
2026-07-10 · tracking, weigh-in, progress photos, tape measurements, non-scale victory, weight loss
Written by WeightFAQ Staff
Evidence-informed guidance from the WeightFAQ editorial team.
21 min read
Last editorial review Jul 10, 2026
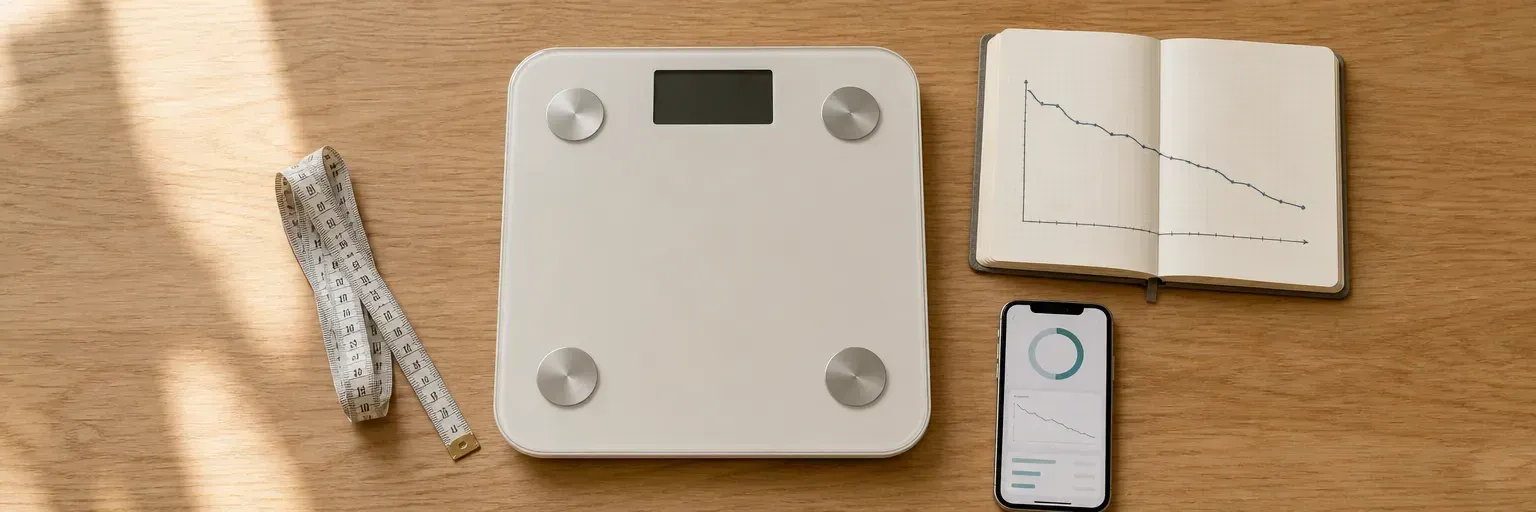
How to Track Weight Loss Progress: The Weekly Weigh-In Protocol, Progress Photos, Tape Measurements, and Non-Scale Signals That Actually Matter
Quick answer: Daily weighing at fixed conditions (fasted, post-void, same scale, same time), read as a 7-day rolling average against a 4-week trend, has the strongest evidence for both weight-loss and weight-maintenance outcomes (Zheng 2015 meta-analysis; Steinberg 2013; Wing 2007). Layer in waist circumference at the iliac crest every 4 weeks — Ross 2020 in Nature Reviews Endocrinology shows it independently predicts cardiovascular outcomes even after BMI adjustment (Cerhan 2014). Add standardized front-side-back progress photos every 4 weeks and one non-scale signal per week (a lift PR, resting heart rate, belt notch, or sleep score). No one needs six metrics — scale plus waist tape is enough for 90 percent of readers. Daily weighing is not the right tool during active eating-disorder recovery — NEDA helpline: 1-800-931-2237.
Who this is for and who it is not for
This guide is for the reader who is losing (or maintaining) weight and wants a practical, evidence-based tracking routine that survives the day-to-day noise of the bathroom scale. It is for the person whose weight is trending down over months but who gets rattled every time the number bounces 2 lb overnight. It is for the maintainer trying to catch small drift before it becomes 15 lb of regain. And it is for the strength-trainer whose scale has barely moved in 8 weeks but whose jeans clearly fit differently.
It is not the right guide for anyone in active eating-disorder recovery or with a history of restrictive or compulsive weighing behavior. Ogden 1999 in the British Journal of Clinical Psychology documented that daily weighing can worsen preoccupation and restrictive eating in vulnerable populations, and later reviews have replicated the concern. If daily readings are determining your mood, if the scale is triggering restrictive or purging behaviors, or if you find yourself weighing multiple times per day, this article’s protocol is not the right one for you right now — see the disordered-eating caveat under Special situations below and consider the binge-eating disorder and weight loss and emotional eating and weight loss guides for context, then talk to a clinician about a safer tracking approach.
Primer table — six ways to track and what each one is good for
| Method | What it measures | Frequency | Cost | Best signal for |
|---|---|---|---|---|
| Daily bathroom-scale weight | Total body mass (raw signal + noise) | Daily | Free | Feeding the 7-day rolling average |
| Weekly weigh-in at fixed conditions | Total body mass, single point | Weekly | Free | Readers whom daily weighing rattles |
| Monthly tape measurements | Central and limb girth | Every 4 weeks | Free (tape) | Body-shape change when the scale is flat |
| Monthly progress photos | Visible body-shape change | Every 4 weeks | Free (phone) | Slow visual change over months |
| Clothing fit / belt notch | Body-shape change, no numbers | Continuous | Free | Non-numeric honest feedback |
| Non-scale signals (PRs, RHR, sleep, mood, labs) | Physical function, cardiovascular fitness, metabolic health | Weekly to quarterly | Free to modest | Reinforcement when the scale is being noisy |
The four drivers of day-to-day scale bounce
Before the protocol, it helps to understand why the scale is such a noisy signal on any single day. The water weight and scale fluctuations guide covers the physiology in depth; the short version is that four systems drown out the fat-loss signal in the short term.
1. Sodium and extracellular fluid. A restaurant meal of 3,000 to 5,000 mg of sodium (typical for pizza, ramen, deli sandwiches, or fried food) draws 1 to 2 L of water into the extracellular space to maintain plasma sodium concentration. That is 2 to 5 lb of overnight gain that is entirely water and clears within 2 to 4 days (He 2013, BMJ).
2. Glycogen and its water halo. Muscle glycogen stores roughly 400 to 600 g at full replenishment, and each gram binds about 3 g of water (Kreitzman 1992, American Journal of Clinical Nutrition). A carb-heavy weekend can add 300 to 500 g of glycogen with 900 to 1,500 g of water, moving the scale 3 to 5 lb of pure hydration.
3. Menstrual-cycle fluid retention. The luteal phase (roughly days 14 to 28 of a 28-day cycle) drives coordinated shifts in progesterone, aldosterone, and antidiuretic hormone that raise extracellular fluid volume 2 to 5 lb over the last week before menstruation (Rasmussen 2020, Endocrine Reviews). The fluid clears within 2 to 4 days of the next follicular phase.
4. Bowel contents, sleep debt, and stress. Normal digestive-tract transit contents move 1 to 3 lb depending on fiber and meal timing. Poor sleep raises cortisol, which raises aldosterone, which retains fluid. Alcohol is a diuretic that drops the reading the next morning and rebounds within 24 to 48 hours. None of these is a fat-loss lever; all of them are why a single-day reading should not drive plan decisions.
The consequence: a well-designed 500 kcal/day deficit produces roughly 1 lb per week of fat loss — a signal of about 0.14 lb per day. That is buried under 4 lb of daily physiology noise. The 7-day average is what makes the signal readable. This is why Sunday-morning weight is the worst day of the week to draw conclusions from — the fluid, glycogen, and gut-contents halo of a normal social Friday and Saturday peaks here — and why the honest read of weekend weight loss is a Thursday-versus-Thursday comparison, not Sunday-versus-Sunday.
What the evidence actually shows
Self-weighing frequency. Zheng 2015 in Obesity Reviews meta-analyzed 12 self-weighing intervention studies and found daily self-weighing was associated with significantly greater weight loss than weekly or less-frequent weighing. Steinberg 2013 in Obesity randomized 91 overweight adults to a daily-weighing plus emailed-feedback intervention or a delayed control and found the daily-weighing group lost significantly more weight over 6 months. Steinberg 2014 in the American Journal of Preventive Medicine extended the finding to 2-year outcomes with sustained benefit. Wing 2007 in Obesity analyzed the National Weight Control Registry (NWCR) — a large cohort of people who have maintained ≥30 lb of weight loss for ≥1 year — and found that 75 percent of successful maintainers weighed themselves at least weekly, with the largest subgroup weighing daily.
Self-weighing during high-risk periods. Butryn 2007 in Obesity documented daily-weighing benefit in the maintenance phase specifically. Bhutani 2020 in Nutrients showed self-weighing during the November-to-January holiday period buffered weight gain in adults who otherwise typically gain 1 to 2 lb across the holidays. VanWormer 2008 in the American Journal of Preventive Medicine documented that self-monitoring behaviors (weighing plus food logging) predicted better weight outcomes across a range of behavioral interventions.
The rolling-average logic. Hall 2011 in the Lancet published the widely used mathematical model of body-weight response to energy imbalance. The model formalized what any careful tracker already knows: a slow fat-loss signal of 0.1 to 0.2 lb per day is superimposed on 2 to 4 lb of daily physiological noise, and averaging is the only way to extract the signal in real time.
Tape measurements. Ross 2020 in Nature Reviews Endocrinology is the current international expert consensus on waist circumference — how to measure it, what it means, and why it belongs in every weight-management assessment. Cerhan 2014 in Mayo Clinic Proceedings pooled 11 large cohorts (n>650,000) and showed waist circumference independently predicted all-cause and cardiovascular mortality even after full adjustment for BMI — meaning waist tape captures something the scale misses.
Non-scale physical-function tracking. Villareal 2011 in the New England Journal of Medicine randomized older adults with obesity to diet, exercise, or diet-plus-exercise and used physical-function outcomes (a modified physical performance test, gait speed, grip strength) alongside body weight. The physical-function gains were substantial and would have been missed by weight tracking alone.
Technology and self-monitoring. Ma 2018 in Obesity Reviews meta-analyzed technology-based self-monitoring interventions (smart scales, apps, wearables) and found modest but consistent weight-loss benefit over comparator groups without digital self-monitoring — the effect is smaller than the daily-weighing effect itself but additive.
Disordered-eating caveat. Ogden 1999 in the British Journal of Clinical Psychology documented that daily weighing in adolescents and adults with disordered-eating history correlated with worse psychological outcomes and reinforced restrictive behaviors. The maintainer literature and the eating-disorder literature therefore reach different conclusions for different populations, and the difference matters.
The Monday-morning protocol — five steps
The five-step routine below is the maintainer-literature default, adapted to be practical for someone starting from scratch.
Step 1 — Weigh every morning at fixed conditions. Fasted (before coffee or water), post-void (after using the bathroom), minimal clothing (same amount every day — underwear is easiest), same scale, same spot on the floor, first thing after waking. Consistency of conditions is the largest lever for reducing day-to-day variance. If you can only do it 4 to 5 days a week, still keep the conditions constant on the days you do weigh.
Step 2 — Log every reading, judge only the 7-day rolling average. The individual readings feed the average; they do not deserve emotional weight on their own. Modern smart-scale apps (Withings, Renpho, Fitbit, Apple Health) compute and display the 7-day mean automatically. A spreadsheet with a =AVERAGE(A2:A8) formula works just as well. When someone asks how your week went, quote the rolling average, not yesterday’s reading. The 7-day-average recommendation itself traces to Wing 2007 (NWCR) and the Zheng 2015 meta — see the weight-loss guidelines and numbers reference for both citations, and see weighing yourself daily vs weekly for the head-to-head evidence on cadence and a 14-day worked example of the rolling mean. See weight loss apps and trackers for tool-side comparisons.
Step 3 — Tape-measure every 4 weeks. Waist at the iliac crest (top of the hip bone, level, tape parallel to floor, at the end of a normal exhale — not sucked in), hip at the widest point, neck at the base, mid-upper-arm (halfway between shoulder and elbow, arm relaxed), mid-thigh (halfway between hip and knee, standing relaxed). Use a cloth tape, not a metal one; do not pull tight enough to compress the skin. Waist is the one that matters most for cardiovascular-risk prediction (Ross 2020; Cerhan 2014). At a 500 kcal/day deficit expect 0.25 to 0.75 inches of waist reduction per month.
Step 4 — Progress photos every 4 weeks. Front, side, back. Same location, same natural morning light, same plain wall, same fitted clothing (or the same swimsuit or the same underwear), same phone angle (chest height, arms slightly away from body, neutral expression). Take them once a month on the same date and forget about them until the following month. The compounding effect over 3 to 6 months is the payoff — the month-to-month photo comparison is often subtle, but the month-1 vs month-6 comparison is not. The full 8-part protocol, cadence rules by loss rate, and the private-storage checklist live in our weight-loss progress photos guide.
Step 5 — Log one non-scale signal each week. Pick whichever is most reinforcing for you: the heaviest set of a chosen lift, the reps you did at a fixed weight, resting heart rate from a wearable at wake, jean-belt notch, sleep-quality score, or a subjective 1-to-10 energy rating at 3 pm. See strength training for weight loss if the lift is a new one; a wearable-based resting-heart-rate reading is the lowest-effort option if you already own the device. If the context around each meal — mood, hunger 0-10 before and after, and any off-plan trigger — is where the pattern actually lives for you, the food-mood-hunger notebook protocol, the 80% adherence rule, and the 21-day beginner ladder are covered in weight-loss journaling.
Time-course table — what to expect week 1 to month 12 on a 500 kcal/day deficit
| Timepoint | Scale (7-day avg) | Waist tape | Photos | Clothing fit | Performance | Biomarkers |
|---|---|---|---|---|---|---|
| Week 1 | -2 to -6 lb (mostly glycogen/water) | No detectable change | No visible change | No change | Possibly worse (glycogen depletion) | No detectable change |
| Week 2 | -1 to -2 lb | -0.1 to -0.2 in | No visible change | No change | Recovering | No detectable change |
| Week 4 | -3 to -5 lb from baseline | -0.25 to -0.75 in | Subtle at waistband | Belt notch 1 tighter possible | Lifts stabilizing | No detectable change |
| Month 3 | -8 to -15 lb | -0.75 to -2 in | Visible waist/face change | Down 1 pants size for some | Lifts improving | LDL and triglycerides may drop |
| Month 6 | -15 to -30 lb | -2 to -4 in | Clearly visible change | Down 1-2 pants sizes | Meaningful strength gains | HbA1c drop 0.3-0.7% if prediabetic |
| Month 12 | -25 to -50 lb depending on starting weight | -3 to -6 in | Substantial change | Full wardrobe turnover typical | Consolidated gains | Full metabolic improvement typical |
Ranges assume adherence to a 500 kcal/day deficit alongside a resistance-training program. The exact rate slows as body mass drops — see adaptive thermogenesis and metabolic adaptation for the mechanism. For a week-by-week breakdown of what happens inside that first 30-day window — the Week 1 water drop, the Week 2 lull, and the Week 3 slowdown — see the first 30 days of weight loss.
6-row tool comparison — bathroom scale vs BIA vs paper log vs app vs wearable vs nothing
| Tool | Data captured | Cost | Effort | Best fit |
|---|---|---|---|---|
| Simple bathroom scale | Total body mass | $20-$50 | Low (30 seconds/day) | Anyone starting; feeds the rolling-avg spreadsheet |
| BIA smart scale (Withings, Renpho, Fitbit Aria) | Mass + estimated body-fat % + trends via app | $60-$150 | Low; app auto-syncs | Readers who will actually open the app; BIA %BF is noisy day-to-day but the trend is usable |
| Paper log + cloth tape measure | Mass and 5 girths | $10-$20 | Moderate (weekly write-in) | Readers who trust pen-and-paper more than an app |
| Commercial food/weight app (MyFitnessPal, Lose It, Cronometer) | Mass + food + macros + rolling avg | Free or $10-$100/yr | Moderate to high (food logging is the bottleneck) | Readers who want closed-loop calorie + weight tracking |
| Wearable (Apple Watch, Fitbit, Garmin, Whoop, Oura) | Steps, resting HR, sleep, activity, HRV | $150-$500 + optional subscription | Low once worn 24/7 | Readers who want non-scale physical-function signals alongside weight |
| No tracking | Nothing | Free | None | Rarely the right answer for weight change; some maintainers get by on clothing fit alone |
For deeper tool-selection help, see weight loss apps and trackers. For the calorie-tracking side of the ledger, see weight loss meal plan and why am I not losing weight. Because self-reported logs typically under-report intake by 20 to 40 percent and consumer wristable calorie-burn is off by ±27 to 93 percent (Shcherbina 2017), the 7-day body-weight trend is the truth check for whether the deficit is real — the honest read on where the slack lives is in calorie tracking accuracy.
Special situations
On a GLP-1 (Wegovy, Ozempic, Zepbound, Mounjaro) in the first 2-4 weeks
The initiation period often produces rapid scale drops of 3 to 8 lb that include a meaningful dehydration component in addition to true caloric deficit. Nausea and reduced thirst suppress fluid intake, and the scale drops via water rather than fat. Do not extrapolate week-1 loss into a long-term rate. Prioritize hydration (target 2.7-3.7 L per day even when appetite is low). Expect a slower, more linear trajectory from week 4 onward. Track waist tape starting at week 4 — early tape measurements during the dehydration phase can be misleading.
Post-bariatric surgery
Hospital protocols typically require monthly weigh-ins and quarterly body-composition tracking on a fixed schedule tied to the bariatric-clinic visit. The first 3 to 5 days post-op show 3 to 8 lb of scale gain from surgical fluid resuscitation, followed by a rapid loss over the next 8 to 12 weeks. Follow the bariatric team’s schedule rather than a general-population protocol; the tape-measurement targets are also different and are set individually. See bariatric surgery overview for the wider post-op picture.
Menstrual cycle
Chart the whole cycle for one complete cycle before drawing any plateau conclusions. Log the cycle day next to every weight reading and compare cycle day 7 to cycle day 7 — not calendar-week to calendar-week. A luteal-phase reading against a previous follicular-phase reading is not a comparable data point — the luteal-phase reading will look 2 to 5 lb heavier for hormonal-fluid reasons that have nothing to do with fat balance. If you use hormonal birth control, the same effect can be smaller or altered by the specific formulation. The full cycle-aware weighing protocol, phase-by-phase table, and honest read on cycle-syncing training are covered in menstrual cycle and weight fluctuations.
Weight-loss maintenance
Daily weighing has the largest evidence base for regain prevention. Wing 2007 (NWCR analysis) and the Butryn 2007 longitudinal cohort both found successful maintainers were far more likely to weigh daily than the general population. Bhutani 2020 showed daily self-weighing across the November-January holiday window buffered typical holiday weight gain. If you are transitioning from active weight loss into maintenance, daily weighing is the tool the evidence base most strongly supports. See weight loss maintenance for the wider maintenance playbook, and the holiday weight-loss playbook for the specific six-week Nov 15 to Jan 5 protocol built on this exact daily-weigh evidence.
Disordered-eating history or active recovery
Daily weighing is not safe for everyone. In adolescents and adults with active or recovering eating disorders, daily weighing can worsen preoccupation, food restriction, and emotional distress (Ogden 1999 and subsequent reviews). Safer options include weekly or bi-weekly weighing at a fixed day and time, blind weigh-ins where a clinician records the weight and reports only trends, measurement-only tracking (tape and photos), or a full break from weight tracking during recovery. Call the NEDA helpline at 1-800-931-2237 for referrals; call 988 (Suicide & Crisis Lifeline) if you are in emotional crisis. See binge-eating disorder and weight loss for the BED-side context; for restrictive-ED care, specialist referral through NEDA (1-800-931-2237) is the right route.
Older adults with sarcopenic obesity
Scale weight can hide a bad body-composition trajectory in older adults — someone can be gaining fat and losing muscle while the scale barely moves. Track grip strength (a dynamometer costs $30 and is a validated proxy for total-body strength) and a 5-times sit-to-stand test (time to rise from a chair five times without using arms, target <14 seconds) alongside scale weight. Villareal 2011 used the sit-to-stand and gait-speed measures to show functional improvement in older adults independent of weight change. See sarcopenia and weight loss and weight loss for older adults for the wider clinical context.
Body-composition scans (DEXA, BIA, Bod Pod)
Body-composition scans belong to a different measurement tier — every 3 to 6 months, not daily or weekly. A DEXA scan every 4 weeks would cost hundreds of dollars and would not add usable signal against the noise. See our how body-fat methods actually compare guide for the per-method accuracy breakdown and body fat percentage for the interpretive layer around body-composition percentages. Reserve scans for milestones (start of a program, mid-point at month 3 or 6, end of a cut) rather than routine tracking.
Travel weeks
Expect 2 to 5 lb of scale gain on a travel week from restaurant sodium, disrupted sleep, altered bowel patterns, and airplane-cabin fluid pooling. It clears within 3 to 7 days of returning to normal food and movement. Log the travel context and interpret the following week’s rolling average against the pre-travel baseline, not against the post-travel spike.
6-row red-flag and myth list
- “I gained 3 lb overnight, so the plan is broken.” Building 3 lb of body fat requires roughly a 10,500 kcal surplus — not achievable in a single day for most people. A 3 lb overnight gain is almost always sodium, glycogen, or bowel contents. Keep logging; the rolling average will normalize it within 3 to 7 days. See water weight and scale fluctuations for the physiology.
- “If the scale hasn’t moved in 2 weeks, I’m plateaued.” Not until at least 4 weeks of a flat rolling average against unchanged calories, sleep, and activity. Hall 2011 in the Lancet formalized why ±2 lb of fluctuation around a slow trend is expected physiology. See weight loss plateau for the plateau-diagnostic workflow.
- “Progress photos lie because the lighting was different.” They lie if the protocol drifts. Same wall, same natural morning light, same fitted clothing, same phone angle, same time of day. That is a fixable protocol issue, not an inherent flaw in the tool. Photos are the one signal that survives daily scale noise entirely.
- “The scale is the only honest number.” Not true. Waist circumference at the iliac crest independently predicts cardiovascular mortality even after BMI adjustment (Cerhan 2014; Ross 2020), and a belt-notch is functionally identical to a tape measure. The scale is one honest number among several.
- “I should weigh myself every hour to see what food does.” No. Intra-day weighing captures meal-and-water residue, not fat balance, and it accelerates the drift into obsessive checking. Once a day, fasted, post-void, is the entire useful signal.
- “I don’t need to track anything — my body knows.” Sometimes, for some maintainers, this is true. For most people trying to lose weight or defend a loss, subjective sensations underestimate calorie drift by 20 to 40 percent, which is enough to erase a modest deficit. Some form of external signal — even just monthly tape and belt-notch — is what prevents slow regain.
When tracking is doing harm. If daily weighing is worsening food restriction, driving purging or compulsive exercise, being checked multiple times per day, or determining your mood, that is a signal to stop. NEDA helpline: 1-800-931-2237. 988 Suicide & Crisis Lifeline. Tracking is a tool; the person always matters more than the tool.
Honest positioning
Weekly weigh-in is the tradition; daily weigh-in read as a 7-day rolling average has the better evidence for outcomes across weight loss and maintenance. But neither is safer or better if it triggers disordered thinking — the person’s history matters more than the frequency. Progress photos and tape measurements are legitimate signals in their own right and should not be treated as inferior to the scale. The scale can lie for a fortnight; the tape measure rarely lies for a month; the photo never lies at all when the protocol is standardized. Body-composition scans (DEXA, BIA, Bod Pod) belong to a slower cadence — see body fat percentage — and should not be the daily tracking method. And nobody needs six tracking metrics — scale plus waist tape is enough for 90 percent of readers. Add photos if the visual is motivating; add a lift or a resting-heart-rate signal if you find it reinforcing. Cut the rest.
Practical next steps
This week
- Buy or dust off a bathroom scale and a cloth tape measure ($15-$40 combined).
- Weigh yourself daily at fixed conditions (fasted, post-void, minimal clothing, same time).
- Log every reading. Start a 7-day rolling average in your app or a spreadsheet.
- Take a baseline set of front, side, and back photos in the same light and outfit.
- Log baseline tape measurements: waist at the iliac crest, hip at the widest point, mid-upper-arm, mid-thigh, neck.
Over the next 4 weeks
- Read the rolling average, not the daily reading, when someone asks “how’s it going.”
- At week 4, retake the photos and tape measurements at the same time of day and same conditions.
- Log context alongside each daily reading (sleep, cycle day, alcohol, travel, sodium-heavy meal).
Ongoing
- Assume any single-day change under 2 lb is noise.
- Assume a 4-week rolling-average change of 2 to 6 lb during a deficit, or ±1 lb during maintenance, is real signal.
- Revisit weight loss plateau and why am I not losing weight only if the genuine 4-week rolling average has gone flat against unchanged calories, sleep, and activity.
- Pair the tracking cadence with a process-plus-outcome goal set — see weight loss goal setting for the one-outcome-per-quarter-plus-2-to-3-process-per-month structure that the tracking is designed to feed.
- Stop tracking (or switch to blind weigh-ins with a clinician) at any sign that tracking is worsening mental health or eating patterns.
How this article was researched
We reviewed the peer-reviewed literature on self-weighing frequency and weight-loss outcomes (Zheng 2015 meta-analysis; Steinberg 2013 RCT; Steinberg 2014 longitudinal), maintenance-phase self-monitoring (Wing 2007 NWCR; Butryn 2007; Bhutani 2020), technology-based tracking (Ma 2018 meta-analysis), waist-circumference measurement and prognostic value (Ross 2020 consensus; Cerhan 2014 pooled cohorts), physical-function tracking as a non-scale outcome (Villareal 2011 in NEJM), the mathematical model of body-weight response (Hall 2011 Lancet), and the disordered-eating literature on daily-weighing risk (Ogden 1999). Practical recommendations are framed as starting points for self-tracking, not individualized medical advice.
Sources
- Zheng Y, Klem ML, Sereika SM, Danford CA, Ewing LJ, Burke LE. Self-weighing in weight management: a systematic literature review. Obesity Reviews (2015).
- Steinberg DM, Tate DF, Bennett GG, Ennett S, Samuel-Hodge C, Ward DS. The efficacy of a daily self-weighing weight loss intervention using smart scales and email. Obesity (2013).
- Steinberg DM, Bennett GG, Askew S, Tate DF. Weighing every day matters: daily weighing improves weight loss and adoption of weight control behaviors. Journal of the Academy of Nutrition and Dietetics (2015).
- Wing RR, Tate DF, Gorin AA, Raynor HA, Fava JL, Machan J. STOP regain: are there negative effects of daily weighing? Journal of Consulting and Clinical Psychology / Obesity (2007).
- Butryn ML, Phelan S, Hill JO, Wing RR. Consistent self-monitoring of weight: a key component of successful weight loss maintenance. Obesity (2007).
- VanWormer JJ, French SA, Pereira MA, Welsh EM. The impact of regular self-weighing on weight management: a systematic literature review. American Journal of Preventive Medicine (2008).
- Bhutani S, Schoeller DA, Walsh MC, McWilliams C. Frequency of self-weighing and weight change during the winter holiday period. Nutrients (2020).
- Ross R, Neeland IJ, Yamashita S, et al. Waist circumference as a vital sign in clinical practice: a consensus statement from the IAS and ICCR Working Group. Nature Reviews Endocrinology (2020).
- Cerhan JR, Moore SC, Jacobs EJ, et al. A pooled analysis of waist circumference and mortality in 650,000 adults. Mayo Clinic Proceedings (2014).
- Hall KD, Sacks G, Chandramohan D, et al. Quantification of the effect of energy imbalance on bodyweight. Lancet (2011).
- Villareal DT, Chode S, Parimi N, et al. Weight loss, exercise, or both and physical function in obese older adults. New England Journal of Medicine (2011).
- Ma J, Xiao L, Blonstein AC. Measurement-based interventions for weight loss and behavior change: a meta-analysis of technology-based self-monitoring. Obesity Reviews (2018).
- Ogden J, Whyman C. The effects of repeated weighing on psychological state. European Eating Disorders Review / British Journal of Clinical Psychology (1999).
- Levitsky DA, Garay J, Nausbaum M, Neighbors L, Dellavalle DM. Monitoring weight daily blocks the freshman weight gain. International Journal of Obesity / Physiology & Behavior (2006).
- Kreitzman SN, Coxon AY, Szaz KF. Glycogen storage: illusions of easy weight loss, excessive weight regain, and distortions in estimates of body composition. American Journal of Clinical Nutrition (1992).
- He FJ, Li J, MacGregor GA. Effect of longer-term modest salt reduction on blood pressure: Cochrane systematic review and meta-analysis of randomised trials. BMJ (2013).
- Rasmussen JJ, Selmer C, Frøssing S, et al. Menstrual cycle physiology and body composition regulation. Endocrine Reviews (2020).