2026-05-31 · nutrition labels, calorie counting, food literacy, weight loss
Updated 2026-07-31
Written by Maya Patel
Maya Patel is a WeightFAQ staff writer covering sustainable weight loss through mindful eating, flexible routines, and evidence-based nutrition. She translates research on protein, fiber, portion control, and calorie awareness into practical meal-planning guidance readers can actually follow at home. Her articles favor honest expectations over fad promises — small changes that compound, calorie bands scaled to real households, and grocery lists built around whole foods with room for real life. Maya writes for people juggling family meals, busy weeks, and long-term goals, not gym-optimized single adults with unlimited prep time.
12 min read
How to Read Nutrition Labels for Weight Loss
Quick answer
Read the serving size first, then multiply by how many servings you actually ate — most weight-loss “mystery calories” hide in that one step. After that, only three numbers really matter for fat loss: calories, protein, and fibre. Ignore the % Daily Value column; it is calibrated to a generic 2,000-calorie diet, not yours. Front-of-package claims like “natural,” “light,” or “no added sugar” are marketing, not nutrition information. Label calories can be off by up to 20 percent under FDA rules, so treat them as estimates paired with a weekly weight trend.
Key takeaways
- The serving size is the single biggest source of label-reading errors. Most packages contain more than one serving.
- The three numbers that actually move weight loss are calories, protein, and fibre — in that order.
- The % Daily Value column is based on a 2,000-calorie diet and is rarely useful for weight loss tracking.
- Front-of-package claims (“natural,” “light,” “no added sugar”) are loosely regulated marketing. The nutrition facts panel on the back is what is regulated and reliable.
- FDA rules allow label calories to be off by up to 20 percent in either direction, so use a 7- to 14-day weight trend, not a single label, to judge whether your target is working.
Why nutrition labels matter for weight loss
If you are counting calories, hitting a protein target, or trying to eat more fibre, the nutrition facts label is the most reliable single source of information you have. Front-of-package marketing changes constantly, but the panel on the back is standardised and regulated, which means once you can read it, you can read it on any product. Several large reviews of consumer research have found that adults who use nutrition labels routinely have lower overall calorie intake and a modestly lower body weight than non-users — the difference is not dramatic, but it shows up consistently across studies.
The catch is that label literacy is a learnable skill, not an instinct. Studies of US and UK shoppers have repeatedly shown that many people can locate the calorie number but stumble on serving size, total servings, or interpreting % Daily Value correctly. That is exactly where the highest-leverage habit changes live. For a full primer on the tracking side of the equation, see our guide to how to count calories.
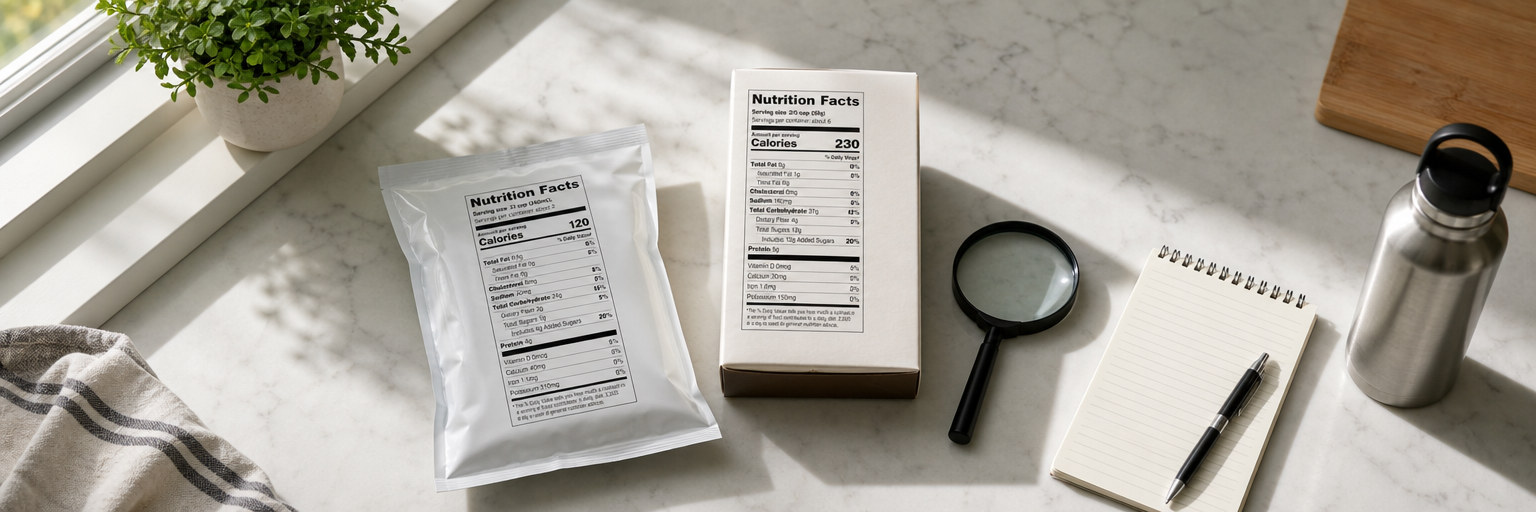
Anatomy of a US nutrition facts label
A standard US nutrition facts label is organised top to bottom in a fixed order. Reading it in that order — slowly, the first few times — is the easiest way to avoid mistakes.
- Serving size (top, bold): the typical amount one person eats in one sitting, set by the FDA based on consumption data.
- Servings per container: how many of those servings are in the whole package. This is the line most people skip.
- Calories per serving (large, bold): the calories in one serving — not the whole package.
- Total fat / saturated fat / trans fat, in grams and %DV.
- Cholesterol in milligrams and %DV.
- Sodium in milligrams and %DV.
- Total carbohydrate, with two sub-lines:
- Dietary fibre
- Total sugars and below it Added sugars (mandatory since the 2016 label refresh).
- Protein in grams.
- Vitamin D, calcium, iron, and potassium in mg/mcg and %DV.
For weight loss, your eyes should jump straight from serving size and servings per container to calories, protein, and fibre. Saturated fat and sodium are useful to know for general health, but they are not the levers that change body weight.
Serving size: the #1 trap
Serving size is where almost every label-reading mistake starts. The FDA sets serving sizes to reflect what people typically eat in one sitting, not what is healthy or what fits a portion plan. That has two consequences.
First, many “single packages” actually contain multiple servings. A 13 oz bag of tortilla chips might list 150 calories per 1 oz serving with about 13 servings per bag — that is roughly 1,950 calories if you eat the whole bag, not 150. Common multi-serving culprits include:
- Chips and crackers: 2 to 4 servings per bag.
- Bottled drinks (large iced teas, sweet teas, some sodas): 2 to 2.5 servings per bottle.
- Jarred sauces, dressings, and dips: 4 to 10 servings per jar.
- Pints of ice cream: 3 to 4 servings per pint.
- Cereal and granola: serving sizes of 1/3 to 1/2 cup that almost nobody actually pours.
Second, after a 2016 label rule update, very large or “consumed at once” packages must show a dual-column label — one column per serving, one column per package — or list total calories for the package as a whole. Look for those columns on big bottles, pints, and family-size snack bags; they save you the multiplication.
A useful default: every time you pick up a packaged food, read the serving size and servings per container together, before looking at calories. If your real portion does not match the serving size, do the math. This single habit removes most accidental over-eating in tracked diets. The same logic underpins the hand and plate portion methods for people who would rather not weigh foods at all.
The 3 numbers worth checking for weight loss
Once serving size is correct, focus on three numbers and let the rest stay in the background.
Calories. The headline. This is what you will compare against your daily target. If you do not have a target yet, see our calorie target guide.
Protein. The most filling macronutrient and the strongest protector of lean mass during a calorie deficit. For weight loss, most adults do well at 1.2 to 1.6 g of protein per kg of body weight per day. On the label, anything that supplies 10 g or more of protein per serving — Greek yogurt, cottage cheese, eggs, tofu, edamame, canned fish, jerky, high-protein bread — is doing real work for fat loss. See the protein intake guide for body-weight-based targets.
Fibre. Fibre slows digestion, blunts blood-sugar spikes, and increases satiety per calorie. Most adults need 25 to 35 g a day, and most fall well short. Anything with 3 g or more of fibre per serving is a useful contributor; 5 g or more is excellent. Beans, lentils, oats, whole grains, raspberries, pears, and high-fibre cereals are the easiest places to find it.
Calories tell you the cost of the food. Protein and fibre tell you what you are getting in return.
What to mostly ignore
A surprising amount of a nutrition label is noise once you have a calorie target.
- The % Daily Value column. %DV is anchored to a generic 2,000-calorie-a-day diet for an average adult. If your weight-loss target is 1,500 calories, that math is already off. The exception is the FDA “5/20 rule” — 5 % DV or less is “low” and 20 % DV or more is “high” — which is useful for added sugar, sodium, and fibre at a glance.
- “No added sugar” claims. Foods can be high in calories from natural sugars, fat, or refined starches and still wear this label honestly. Flip to the panel.
- “Natural,” “wholesome,” “farm-fresh,” “artisan.” These terms are not meaningfully regulated.
- “Light” or “lite.” Defined by the FDA, but only relative to the original product — a “light” salad dressing can still be calorie-dense.
- “Made with whole grains.” Could mean 5 percent or 95 percent. Check the ingredient list and the fibre line.
- “Plant-based” or “vegan.” Says nothing about calorie density.
Randomised studies have repeatedly shown that front-of-package claims create a “health halo” that leads people to underestimate calories and over-serve. The nutrition facts panel on the back is what is enforceable and consistent.
Added sugar vs total sugar
Since the 2016 nutrition facts update, US labels separate total sugars from added sugars. Total sugars include naturally occurring sugars (the lactose in milk, the fructose in fruit) plus anything added during processing. Added sugars are only the ones the manufacturer put in.
For weight loss this distinction matters because added sugars come in mostly calorie-dense, low-fibre, low-protein foods — soda, sweetened yogurts, granola bars, flavoured oatmeal, sauces. Plain Greek yogurt, fruit, and milk can show high total sugars but zero added sugars, and they are filling and nutrient-dense. The American Heart Association recommends capping added sugar at about 25 g per day for women and 36 g for men. The label’s “Added sugars” line makes that target trackable for the first time. The added-sugar line is one of the most important on the label — see our full guide to sugar and weight loss for daily limits, hidden sources, and swap strategies.
Labels for whole foods vs packaged foods
Fresh produce, plain meat, eggs, and bulk staples often do not carry a label at all. That is not a problem — those are usually the foods you do not need to scrutinise. For tracking purposes:
- Use a kitchen scale and a tracking app to log raw foods by weight (chicken breast, salmon, banana, broccoli).
- Use generic database entries from the USDA FoodData Central or the verified entries in your app — they are typically more accurate than user-submitted entries.
- For mixed home-cooked dishes, weigh ingredients as you cook, then weigh the finished dish and log a per-gram amount. Our calorie counting walkthrough covers this in detail.
If you would prefer to avoid weighing altogether, the hand and plate portion methods work without a single label. They are less precise but easier to maintain long term.
US vs UK nutrition labels
If you are reading labels in the UK or buying imported foods, two main differences are worth knowing.
- Per 100 g (and per serving) format. UK labels are required to show nutrition information per 100 g or 100 ml, often alongside a per-serving column. The per-100 g column is excellent for comparing two products fairly — a granola at 480 kcal per 100 g is clearly denser than one at 360 kcal per 100 g, even if their serving sizes differ.
- The traffic-light system. Many UK packaged foods display a voluntary front-of-package traffic-light label, colouring fat, saturated fat, sugar, and salt as green (low), amber (medium), or red (high). Independent research has found that the traffic-light format helps shoppers identify healthier choices faster than text-only labels, though its effect on actual purchases is smaller than its effect on perception.
For UK shoppers, the per-100 g column is the most useful tool the US label does not have. Treat it as a “density meter” when comparing similar products.
Practical next steps
This week: pick three packaged foods you eat regularly — a cereal, a snack, and a sauce or dressing — and re-read each label from serving size downward. Multiply serving size by your real portion. Most people find at least one item where their actual intake is 1.5 to 2× the labelled calories.
Next 2 to 4 weeks: start scanning calories, protein, and fibre at the store. Anything with 10 g protein or 3 g fibre per serving earns a spot in the cart; anything where the first ingredient is sugar, syrup, or refined oil deserves a closer look. For an aisle-by-aisle starter list, see our weight loss grocery list.
Long term: combine label literacy with a portion system you can stick with. For most people, that is a calorie target plus either short-term tracking or hand-portion meals — and a label habit that catches the surprises before they end up on your plate.
Frequently asked questions
Are the calories on nutrition labels accurate? Roughly accurate, not precise. FDA rules allow packaged food labels to be off by up to 20 percent in either direction, and studies of common snack and frozen foods have found average errors of 8 to 18 percent. For weight loss, treat label calories as good estimates and pair them with a 7- to 14-day weight trend rather than worrying about single-day totals.
What does “serving size” mean if I eat the whole package? Serving size is the typical amount one person eats in one sitting, set by the FDA based on consumption data — not a recommendation. Many packages contain more than one serving, so the calories beside the serving size are not the total. Check “servings per container” and multiply: a bag of chips at 150 calories per 1 oz serving with 3 servings per bag is 450 calories if you eat the whole bag. Larger packages now also show a “per package” or dual-column format that saves the math.
Should I check sodium for weight loss? Not for fat loss directly, but it is worth a glance. Sodium does not add calories, but high-sodium meals can cause water retention that masks fat loss on the scale for a day or two — a common cause of “I ate clean and gained a pound” frustration. The American Heart Association recommends staying under 2,300 mg per day. Ultra-processed foods, frozen meals, deli meats, and restaurant dishes are the usual sources. If you are also managing blood pressure, the DASH diet for weight loss provides a structured 2,300 mg or 1,500 mg sodium target and a food pattern that makes label-reading much easier in practice.
What does ”% Daily Value” actually represent? Percent Daily Value (%DV) tells you how much of a nutrient one serving contributes to a generic 2,000-calorie-a-day diet — not your diet. The FDA rule of thumb is that 5 percent DV or less is “low” and 20 percent DV or more is “high.” For weight loss, look at the actual gram and calorie numbers and skip %DV unless you are checking added sugar or sodium against the high/low rule.
Are “organic” or “natural” labels lower in calories? No. Organic, natural, and grass-fed describe how a food was produced or marketed, not how calorie-dense it is. Organic granola, peanut butter, and cookies have the same calories as their conventional versions, and front-of-package “health halos” have been shown to make people misjudge calorie content. Flip the package over — the nutrition facts panel on the back is regulated and consistent; the front is marketing.
Sources
- Consumer understanding and use of nutrition labelling: a systematic review. Public Health Nutrition (2005).
- Nutrition labels on pre-packaged foods: a systematic review. Public Health Nutrition (2011).
- Food label use and its relation to dietary intake among US adults. Journal of the American Dietetic Association (2010).
- Facts up front versus traffic light food labels: a randomized controlled trial. American Journal of Preventive Medicine (2012).