
2026-06-15 · cholesterol, LDL, HDL, triglycerides, cardiovascular, weight loss, heart health, GLP-1, statins, bempedoic acid, PCSK9 inhibitors, Portfolio Diet
Updated 2026-10-01
Written by WeightFAQ Staff
Evidence-informed guidance from the WeightFAQ editorial team.
46 min read
Last editorial review Aug 5, 2026
Cholesterol and Weight Loss: How Much to Lose to Drop Your LDL
Every kilogram of body weight you lose drops LDL cholesterol by about 2 mg/dL and triglycerides by roughly 7 mg/dL — the anchor slope from the Datillo & Kris-Etherton 1992 meta-analysis of 70 weight-loss trials, still the cleanest number in the literature.
A 5 to 10 percent body-weight loss is the threshold where most adults cross an ACC/AHA lipid category. Below is the per-kilogram dose-response table, the statin decision matrix by risk tier, GLP-1 lipid data from STEP-1, SURMOUNT-1, and SELECT, the bempedoic-acid and PCSK9 landscape, and where non-HDL and apoB fit alongside standard LDL.
Quick stats
- LDL drop per kg lost: ~2 mg/dL (Datillo & Kris-Etherton 1992 meta)
- Triglyceride drop per kg lost: ~7 mg/dL
- Clinically-meaningful loss threshold: 5–10% body weight
- Fastest-moving marker: triglycerides (2–4 weeks)
- Slowest-moving marker: HDL (rises after weight stabilizes)
What the lipid panel actually measures
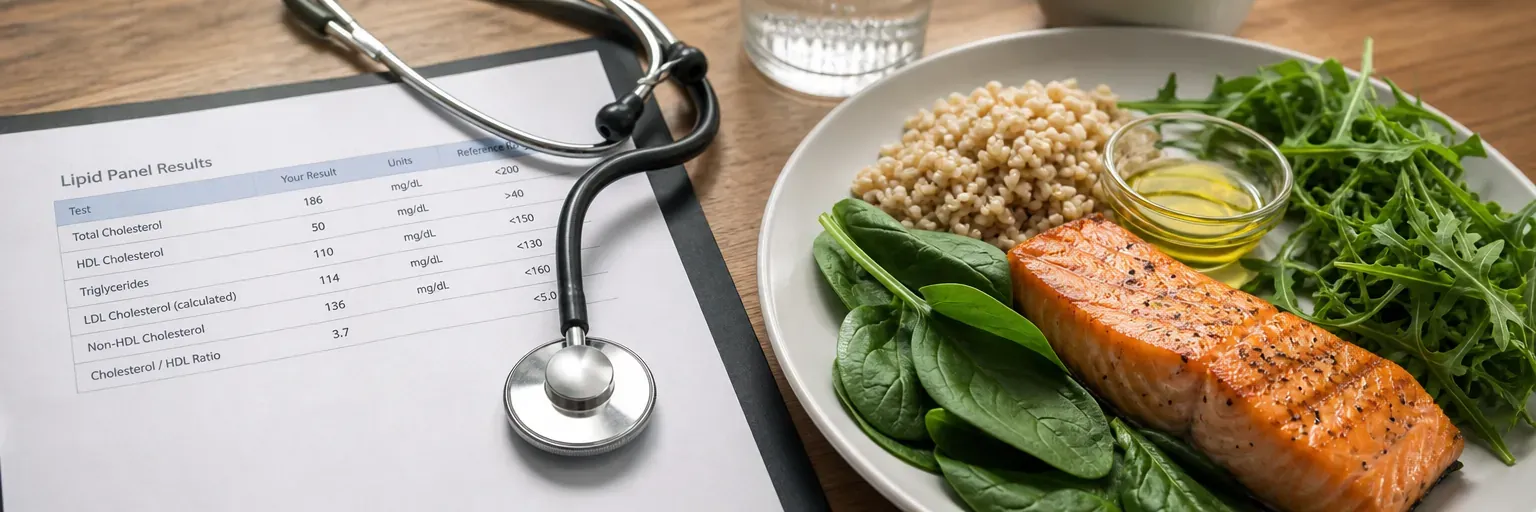
A standard lipid panel reports four numbers, and a fifth is now treated as a co-primary target. LDL cholesterol (“bad”) carries cholesterol from the liver out toward arteries — when oxidized inside the artery wall, it drives atherosclerotic plaque. HDL cholesterol (“good”) carries cholesterol back toward the liver for disposal. Triglycerides are the fats carried in blood that rise sharply after meals and especially after sugar or alcohol. Total cholesterol equals LDL + HDL + about 20% of triglycerides. Non-HDL cholesterol — total minus HDL — captures every atherogenic particle in one number and has become the modern preferred target alongside LDL. ApoB (apolipoprotein B) is the emerging next-step marker; one ApoB molecule sits on every atherogenic particle, so it counts particles directly rather than the cholesterol they carry.
The headline number for weight loss and lipids comes from the Datillo and Kris-Etherton 1992 meta-analysis in the American Journal of Clinical Nutrition, which pooled 70 weight-loss studies and found roughly 0.05 mmol/L (~2 mg/dL) LDL drop per kilogram lost and about 0.015 mmol/L (~7 mg/dL) triglyceride drop per kg. A 5 to 10 percent body-weight loss typically drops LDL 5 to 10 mg/dL, triglycerides 10 to 30 mg/dL, and raises HDL 2 to 5 mg/dL. Stacked with a Mediterranean or DASH-style eating pattern and exercise, the magnitude usually doubles.
Where your numbers should be
The 2018 ACC/AHA cholesterol guideline and the NHLBI ATP III thresholds set the framework most US clinicians still use. UK readers should note that NICE uses millimoles per liter (mmol/L); the conversion is mg/dL × 0.0259 for cholesterol and × 0.0113 for triglycerides.
| Marker | Optimal | Borderline | High | Source |
|---|---|---|---|---|
| LDL cholesterol | <100 mg/dL (2.6 mmol/L) | 100–129 | ≥130 | ACC/AHA 2018 |
| Non-HDL cholesterol | <130 mg/dL | 130–159 | ≥160 | ACC/AHA 2018 |
| HDL cholesterol | ≥60 mg/dL (M ≥40, F ≥50) | 40–59 | <40 | NHLBI ATP III |
| Triglycerides | <150 mg/dL (1.7 mmol/L) | 150–199 | ≥200 | ACC/AHA 2018 |
| Total cholesterol | <200 mg/dL | 200–239 | ≥240 | NHLBI ATP III |
For anyone with established cardiovascular disease, diabetes, or a 10-year ASCVD risk above 7.5 percent, the treatment threshold is lower than the “optimal” column suggests — secondary prevention often targets LDL under 70 mg/dL and sometimes under 55 mg/dL with high-intensity statins. The numbers above are the screening categories, not the treatment goals. In men, new-onset erectile dysfunction often appears 3 to 5 years before a cardiac event and is a useful early warning to recheck lipids and blood pressure — see erectile dysfunction and weight loss.
How much weight loss changes each number
The dose-response is one of the cleanest findings in cardiovascular medicine. The slope flattens beyond about 10 kg of loss, and people who start with the worst numbers tend to see the largest absolute drops. The LDL drop also flows directly into lower stroke risk, since carotid and intracranial atherosclerosis drive the large-artery ischemic stroke subtype.
| Weight loss | LDL change | Triglyceride change | HDL change | Notes |
|---|---|---|---|---|
| 2–5% (~5–10 lb) | ~3–5 mg/dL drop | ~10–20 mg/dL drop | ~1 mg/dL rise | Smallest meaningful lipid shift |
| 5–10% (~10–25 lb) | ~5–10 mg/dL drop | ~20–40 mg/dL drop | ~2–4 mg/dL rise | Crosses one ACC/AHA category for many people |
| 10–15% (~25–40 lb) | ~10–15 mg/dL drop | ~40–60 mg/dL drop | ~4–7 mg/dL rise | Often eliminates statin need at borderline-high |
| 15%+ (typical GLP-1 ≥2.4 mg) | ~15–25 mg/dL drop | ~60–100 mg/dL drop | ~7–12 mg/dL rise | STEP / SURMOUNT trial range |
| 25%+ (typical RYGB or sleeve) | ~25–40 mg/dL drop | ~80–150 mg/dL drop | ~10–15 mg/dL rise | SOS and STAMPEDE long-term data |
The trial backbone is Datillo and Kris-Etherton 1992 plus the STEP-1 lipid sub-analysis (semaglutide), the SURMOUNT-1 lipid sub-analysis (tirzepatide), the Swedish Obese Subjects (SOS) long-term cohort, and STAMPEDE for bariatric outcomes. Triglycerides almost always respond first and most dramatically, particularly when added sugar and alcohol come down alongside the deficit.
Dose-response: how much your numbers move per kg lost
The table above uses body-weight percentages; the table below uses absolute kilograms lost, which is often easier to reason about when you are tracking week-over-week on the scale. The anchor slopes are Datillo and Kris-Etherton 1992 (roughly 2 mg/dL LDL and 7 mg/dL triglyceride drop per kilogram lost in the linear range) with the HDL rise calibrated to the Wing 2007 Look AHEAD 1-year lipid analysis in adults with Type 2 diabetes. Beyond about 10 kg the LDL slope flattens, so the last row is honestly labeled as an extrapolation.
| Weight lost | LDL change | HDL change | Triglyceride change | Notes |
|---|---|---|---|---|
| 2 kg (~4.4 lb) | ~4 mg/dL drop | ~0.5 mg/dL rise | ~14 mg/dL drop | Below the Look AHEAD 5% clinical-shift threshold; triglyceride move is real |
| 5 kg (~11 lb) | ~10 mg/dL drop | ~1.5 mg/dL rise | ~35 mg/dL drop | Crosses one ACC/AHA LDL category for many adults starting in 100–129 |
| 7.5 kg (~16.5 lb) | ~15 mg/dL drop | ~2.5 mg/dL rise | ~50 mg/dL drop | Matches typical Look AHEAD 1-year responder profile |
| 10 kg (~22 lb) | ~18–20 mg/dL drop | ~3.5 mg/dL rise | ~65 mg/dL drop | Slope flattens beyond this point; often triggers statin-reassessment conversation |
| 15 kg (~33 lb) | ~22–28 mg/dL drop | ~5 mg/dL rise | ~85–100 mg/dL drop | Extrapolated; matches STEP-1 / SURMOUNT-1 lipid sub-analyses at similar loss |
The per-kg slope is a group-level average, not a personal prediction. Two adults who both lose 7.5 kg can land 10 mg/dL apart on LDL depending on baseline diet, saturated-fat intake, and whether they replaced calories with mono- and polyunsaturated fat or with refined carbohydrate. Re-test at 8 to 12 weeks rather than at 4 weeks — a shorter window frequently misses a real signal.
Who benefits most from weight-loss-driven lipid change
Not every dyslipidemia pattern responds equally to a calorie deficit. The four-tier framework below helps set expectations before you start — and helps decide whether weight loss is the primary lever, an adjunct to medication, or a secondary tool that will not solve the underlying problem on its own.
| Who you are | Expected weight-loss lipid win | Is it primary or adjunct? | Watch-outs |
|---|---|---|---|
| Borderline LDL (130–159) + low 10-year ASCVD risk | 5–10% loss can drop LDL 5–10 mg/dL and defer a statin conversation for many adults | Primary — reasonable to trial 3–6 months of lifestyle before starting medication | Do not defer if 10-year ASCVD risk climbs above 7.5%; re-check lipids and risk at 3 and 6 months |
| Established CVD or LDL ≥190 (including FH) | Weight loss trims LDL 5–10% but does not close the gap to secondary-prevention targets | Adjunct — statin (often high-intensity) stays; weight loss is additive | Never stop a statin on your own after weight loss; secondary prevention targets LDL <70 or <55 mg/dL |
| High triglycerides + prediabetes / metabolic syndrome | Biggest weight-loss lever on the panel — 20–40% triglyceride drop at 5–10% loss is typical | Primary — this is the pattern most responsive to weight loss; often normalizes with 5–10% loss + refined-carb reduction | If fasting triglycerides ≥500 mg/dL, add clinician-directed therapy (fibrate, EPA); triglycerides ≥1000 is a pancreatitis risk |
| Isolated low HDL (LDL and TG normal) | Modest — HDL rises ~1 mg/dL per 3 kg lost, mostly after weight stabilizes | Adjunct at best — aerobic exercise (150–300 min/week) moves HDL more reliably than weight loss alone | Modern guidelines do not chase an HDL target; the priority stays LDL and non-HDL |
If you fall into more than one row, the row with the highest cardiovascular risk usually wins the treatment conversation — the CVD or FH row overrides everything else. See cardiovascular disease and weight loss for the full risk-stratification frame.
5-step protocol to lower LDL through weight loss
This is the simplest plan that fits the published evidence — borrowed in structure from the blood pressure and weight loss protocol because the cardio-metabolic problem is the same.
Step 1: Set a 5–10% weight-loss target first
The Look AHEAD trial’s secondary lipid analysis showed that adults with Type 2 diabetes who hit a 5 to 10 percent loss saw clinically meaningful LDL and triglyceride improvements that did not appear in the under-5% group. Aim for 0.5 to 1 percent of body weight per week — fast enough to keep momentum, slow enough that the loss is lean-mass-sparing. The deficit math sits in our how many calories to lose weight guide.
Step 2: Cut saturated fat to under 7–10% of calories
The Mensink 2003 controlled-feeding meta-analysis remains the cleanest LDL evidence: every 1 percent of calories you replace from saturated fat with polyunsaturated fat drops LDL by about 2 mg/dL. The 2020 Cochrane review (Hooper) confirmed that saturated-fat reduction lowers cardiovascular events by about 17 percent. The PURE study and several recent observational papers have muddied the all-cause-mortality picture, but on LDL specifically the controlled-feeding evidence is consistent and the saturated-fat reduction still produces the cleanest drop. The AHA’s 10 percent ceiling is the lay-friendly target; under 7 percent is the secondary-prevention version.
Step 3: Hit 25–35 g fiber/day with 10+ g soluble
The Brown 1999 meta and the Anderson 2009 review both converge on 10 g/day of soluble fiber producing about a 5 to 10 mg/dL LDL drop. The mechanism is direct: soluble fiber binds bile acids in the gut, the liver makes more bile to replace them, and that synthesis pulls LDL out of circulation. The cheapest, best-evidenced sources are oats and oat bran, beans and lentils, psyllium husk, apples, and chia. Our fiber for weight loss guide has the full food list and the gradual-increase protocol that avoids GI side effects.
Step 4: Replace saturated fat with mono- and polyunsaturated
Olive oil, nuts (especially walnuts and almonds), avocado, fatty fish, and seeds are the workhorses. The PREDIMED trial randomized 7,447 adults at high cardiovascular risk to a Mediterranean diet supplemented with extra-virgin olive oil or mixed nuts versus a low-fat control, and at 4.8 years the Mediterranean arms cut major cardiovascular events by about 30 percent. Omega-3 (EPA + DHA) at 1 to 2 g per day drops triglycerides 10 to 30 percent — well covered in our healthy fats for weight loss breakdown.
Step 5: Move 150–300 minutes per week, mixing aerobic and resistance
The STRRIDE trial (Kraus 2002, NEJM) showed that exercise alone — even without weight loss — moves the lipid panel. Higher-amount or higher-intensity exercise produced the largest triglyceride drops and HDL bumps. Combine 150 to 300 minutes of moderate aerobic activity with two resistance sessions for the biggest joint lipid shift; HDL responds especially well to aerobic volume.
10-row food-cut / food-add table
The lever weights below are roughly ranked by per-serving impact on LDL or triglycerides. The full pattern, not any one swap, drives the lipid panel.
| Cut or limit | Why | Swap for |
|---|---|---|
| Butter and fatty cuts of red meat | Saturated fat | Olive oil; chicken breast; fish |
| Full-fat cheese (cheddar, brie) | Saturated fat | Part-skim mozzarella; Greek yogurt |
| Coconut oil | Highest saturated-fat content of common oils | Olive oil; canola; avocado oil |
| Pastries and commercial baked goods | Saturated fat + trans-residue + sugar | Oats; whole-grain bread; fruit |
| Fried fast food | Saturated + trans fats | Grilled lean protein; bean bowls |
| Sugar-sweetened beverages | Triglyceride driver | Water; sparkling water; unsweetened tea |
| Refined carbs (white bread, white rice) | Triglyceride driver | Oats; legumes; whole grains |
| Processed meat (bacon, deli, sausage) | Saturated fat + sodium | Beans; lentils; eggs |
| Alcohol above ~1/day (W) or ~2/day (M) | Triglyceride driver | Lower-calorie cocktails; alcohol-free options |
| Tropical and palm oil products | Saturated fat | Olive oil; canola; avocado oil |
The pattern that wins in trials is Mediterranean or DASH — both heavy on vegetables, legumes, olive oil, nuts, fatty fish, and modest whole grains. See the Mediterranean diet for weight loss and DASH diet for weight loss guides for the food lists and weekly plans.
Weight-loss medications and your lipid panel
Lifestyle is first-line, but the medication landscape now has two distinct columns: drugs that target lipids directly, and drugs that lower lipids by producing weight loss. The honest framing matters because mixing them up leads to the wrong drug for the wrong patient.
| Drug class | LDL effect | Triglyceride effect | Notes |
|---|---|---|---|
| Statins (atorvastatin, rosuvastatin) | -30% to -55% | -10% to -20% | First-line for elevated CV risk; pleiotropic anti-inflammatory effects |
| Ezetimibe | -15% to -20% | Minor | Add-on or statin-intolerant; cheap and well tolerated |
| Bempedoic acid | -15% to -20% | Minor | Statin-intolerant; CLEAR Outcomes 2023 showed CV benefit |
| PCSK9 inhibitors (evolocumab, alirocumab) | -50% to -60% | -10% | Injectable; reserved for very high risk or FH |
| Semaglutide / Wegovy / Ozempic | -10% | -22% | STEP-1 at 68 weeks; effect tracks weight loss |
| Tirzepatide / Zepbound / Mounjaro | -13% | -25% | SURMOUNT-1 at 72 weeks; effect tracks weight loss |
Statins remain the most powerful single LDL drug class, and they do not depend on weight loss for their effect. Anyone with established cardiovascular disease, an LDL above ~190 mg/dL, diabetes plus elevated LDL, or a 10-year ASCVD risk above 7.5 percent should be on one unless contraindicated — do not stop without your prescriber. Ezetimibe and bempedoic acid are modest add-ons used when statins are not tolerated or are not enough. Semaglutide and tirzepatide lower the lipid panel mostly through the weight loss they produce, which makes them useful adjuncts when obesity and dyslipidemia sit together. See the GLP-1 weight loss overview for the full picture.
Special situations
Familial hypercholesterolemia (FH)
About 1 in 250 adults has heterozygous familial hypercholesterolemia — a genetic LDL receptor defect that produces lifelong LDL levels typically above 190 mg/dL and high rates of premature coronary disease. Weight loss helps directionally but does not replace medication; the Nordestgaard 2013 European Atherosclerosis Society consensus emphasizes that FH is a high-intensity-statin diagnosis and often requires PCSK9 inhibitors on top. The clues to look for: untreated LDL above 190 mg/dL, a first-degree relative with very high cholesterol or premature coronary disease (men under 55, women under 65), tendon xanthomas, or corneal arcus before age 45. Genetic confirmation is increasingly affordable but is not required to start treatment when the clinical pattern fits.
Women, menopause, and the LDL bump
LDL typically rises 10 to 20 percent across the menopause transition, with the steepest climb in the year before and the year after the final menstrual period. The Study of Women’s Health Across the Nation (SWAN) cohort showed this pattern is largely independent of weight gain — the lipid shift tracks the hormonal transition itself, with estrogen loss reducing hepatic LDL receptor activity. Practical implication: a woman whose LDL has crept from 110 to 135 in her early 50s is not “failing” her diet; she is doing what the average woman does in the perimenopausal window. Weight loss still helps and is one of the more controllable levers, but the threshold for starting a statin tends to come sooner. See menopause and weight loss for the broader frame.
Metabolic syndrome and the triglyceride-driven pattern
The classic metabolic-syndrome lipid pattern is high triglycerides, low HDL, normal-to-borderline LDL, and central adiposity — driven by insulin resistance and excess hepatic VLDL production. This is the lipid panel where non-HDL and ApoB matter more than LDL, because the atherogenic burden hides in the triglyceride-rich particles. The good news: triglycerides respond fastest to weight loss and to dietary changes that reduce refined-carb load. A 5 to 10 percent loss combined with a lower-glycemic-load pattern often normalizes triglycerides within 3 to 6 months. Cross-reference our insulin resistance and weight loss and low-carb / keto guides for the food-pattern detail. The parallel work on the liver sits in fatty liver and weight loss — the same metabolic dysfunction drives both panels. When 3 or more of waist, triglycerides, HDL, BP, and fasting glucose are out of range, the umbrella diagnosis and 5-step reversal protocol live in metabolic syndrome and weight loss.
GLP-1 medications and cholesterol: what the 2026 evidence actually shows
GLP-1 receptor agonists have become a common weight-loss adjunct, but the lipid conversation around them is often reduced to a single “they lower cholesterol” line. The 2026 evidence is more specific — GLP-1s produce a modest LDL move and a much larger triglyceride move, and the cardiovascular-outcome benefit seen in SELECT was not driven by LDL change at all.
| Trial | Drug | Duration | Baseline LDL | Δ LDL at endpoint | Δ triglycerides |
|---|---|---|---|---|---|
| STEP-1 (Wilding 2021) | Semaglutide 2.4 mg | 68 wk | ~124 mg/dL | −3% | −22% |
| SURMOUNT-1 (Jastreboff 2022) | Tirzepatide 15 mg | 72 wk | ~103 mg/dL | −5% | −24% |
| SELECT (Lincoff 2023) | Semaglutide 2.4 mg | ~40 mo | Statin-treated cohort | Modest add-on effect | −15% |
| SURMOUNT-4 (Aronne 2024) | Tirzepatide (withdrawal) | 88 wk | — | Lipid gains reversed on withdrawal | Same |
The pattern is consistent across trials: GLP-1s lower triglycerides more than LDL, and most of the lipid movement is mediated by weight loss and improved insulin sensitivity rather than a direct hepatic effect on LDL receptor activity. In SURMOUNT-1 the LDL drop was ~5% at 72 weeks alongside a 21% mean weight loss — a much smaller LDL move than a low-dose statin delivers.
SELECT — the semaglutide cardiovascular-outcomes trial in adults with established atherosclerotic cardiovascular disease — showed a 20% relative risk reduction in major adverse cardiovascular events over roughly 40 months. Crucially, the benefit was not driven by LDL change. The LDL curves separated only modestly and the mechanistic contribution came from weight loss, blood-pressure improvement, and reductions in inflammation and non-HDL burden acting together. That distinction matters clinically: a patient with established coronary disease and LDL of 130 mg/dL who starts semaglutide still needs a statin, because the LDL move alone will not reach the secondary-prevention target of under 70 mg/dL (and often under 55 mg/dL for very-high-risk patients).
SURMOUNT-4 is the mirror-image finding — participants who withdrew from tirzepatide at week 36 regained the weight and lost the lipid gains within a year. This is worth naming honestly for anyone starting a GLP-1: the lipid improvement is durable only while the drug is taken and while the weight loss is maintained.
Practical framing: GLP-1s are not a substitute for statins in patients with established ASCVD, LDL ≥ 190 mg/dL, familial hypercholesterolemia, or diabetes with elevated LDL. They are a valuable adjunct for triglyceride management and for weight-loss-driven lipid improvement in adults where obesity and dyslipidemia sit together. For the broader indication and dosing frame see GLP-1 weight loss overview and the class comparison in semaglutide vs tirzepatide.
Where GLP-1s fit alongside a statin
For a patient with mixed dyslipidemia, obesity, and either prediabetes or established Type 2 diabetes, the modern default is a moderate-intensity statin plus a GLP-1 — not one or the other. The two drugs act on different levers: the statin drops LDL by about 30 to 50 percent through hepatic HMG-CoA reductase inhibition, while the GLP-1 lowers triglycerides by 20 to 25 percent, drops non-HDL cholesterol through weight loss, and cuts blood pressure by 4 to 6 mmHg. In SELECT the semaglutide arm was already on background statin therapy — the 20 percent MACE reduction was additive to statin benefit, not a replacement for it.
The one case where a GLP-1 might defer a statin conversation is borderline LDL (100 to 130 mg/dL) with a 10-year ASCVD risk under 5 percent and no risk enhancers, in a patient who is starting a GLP-1 for obesity anyway. Even then, a repeat lipid panel at 6 months and an updated ASCVD risk calculation are the trigger for the decision, not a general assumption that the GLP-1 has done enough.
Discontinuation, adherence, and the rebound problem
SURMOUNT-4 is worth revisiting for anyone starting a GLP-1: participants who withdrew from tirzepatide at week 36 regained 14 percent of body weight and lost most of the lipid improvement within a year. The STEP-4 semaglutide withdrawal analysis (Rubino 2021) showed the same pattern.
The clinical implication is not that GLP-1s “do not work” — it is that they are chronic-disease drugs, like statins, and the lipid benefit tracks continued use. Insurance interruptions, side-effect-driven discontinuations (nausea, constipation, gastroparesis), and out-of-pocket cost are real threats to adherence. If a patient’s GLP-1 is at risk of stopping, it is worth having the statin conversation earlier rather than later so the LDL protection does not disappear along with the weight loss.
Monitoring lipids on a GLP-1: a practical schedule
- Baseline — full lipid panel (or non-fasting non-HDL if triglycerides are known-normal), plus ALT/AST, HbA1c, and eGFR before starting.
- 12 weeks — repeat lipid panel. Most of the triglyceride move is visible by this point; LDL will not have moved much.
- 6 months — repeat lipid panel plus HbA1c and weight. This is the point where the LDL change (if any) is visible; use it to inform statin decisions.
- 12 months — full lipid panel and updated 10-year ASCVD risk. If the patient has hit a maintained 10 to 15 percent weight loss and the risk score has fallen below the treatment threshold, a statin deferral may be reasonable.
The one lab that changes fastest on a GLP-1 is fasting triglycerides — often a 30 to 40 mg/dL drop by week 12 driven by the reduced caloric intake and the improved insulin sensitivity. A patient whose triglycerides do not move on a GLP-1 by 12 weeks despite meaningful weight loss should be worked up for a secondary triglyceride driver: alcohol, uncontrolled diabetes, hypothyroidism, or a genetic hypertriglyceridemia.
Statin dose-response: how much LDL drops per dose
If weight loss trims LDL by 5 to 25 mg/dL depending on how much weight comes off, statins are still the largest single lever on LDL in medicine. The Cholesterol Treatment Trialists’ Collaboration 2010 meta-analysis (Lancet 376:1670) — pooling data from 170,000 participants across 26 randomized trials — established the anchor finding: every 1 mmol/L (~39 mg/dL) reduction in LDL cuts the major vascular event rate by about 22 percent, regardless of baseline LDL, age, or sex.
| Statin | Low dose | LDL % drop | High dose | LDL % drop |
|---|---|---|---|---|
| Atorvastatin | 10 mg | 39% | 80 mg | 55% |
| Rosuvastatin | 5 mg | 45% | 40 mg | 63% |
| Simvastatin | 10 mg | 30% | 40 mg | 41% |
| Pravastatin | 10 mg | 22% | 40 mg | 34% |
| Lovastatin | 20 mg | 29% | 80 mg | 42% |
Two features of the table are worth naming. First, rosuvastatin and atorvastatin dominate the class — they are the two high-intensity options in the 2018 ACC/AHA guideline, and both are inexpensive generics. Simvastatin, pravastatin, and lovastatin are legitimate moderate-intensity choices when high intensity is not tolerated or not needed.
Second, the “rule of 6” — doubling the statin dose adds only about 6 percentage points to the LDL reduction. Most of the effect is delivered by the starting dose, which is why dose escalation is a slow lever compared to adding a second agent (see the next section).
Statin intolerance is real but often over-attributed. Herrett 2021 (BMJ 372:n135) ran an N-of-1 nocebo trial in adults who had discontinued a statin due to muscle symptoms: about half of the reported “statin symptoms” occurred equally on placebo days. That does not mean statin myopathy is imaginary — true statin-associated muscle symptoms are well documented at roughly 5 to 10 percent incidence — but it does mean a structured rechallenge, dose reduction, or switch to a hydrophilic option (rosuvastatin, pravastatin) is worth trying before writing off the class.
Practical: patients whose LDL remains at or above 100 mg/dL after 5–10% weight loss plus a moderate-intensity statin should discuss dose escalation or add-on therapy with their clinician. For most patients, adding ezetimibe is the cheapest next step; bempedoic acid or a PCSK9 inhibitor is next when statins are not tolerated or the risk is very high.
Hydrophilic vs lipophilic statins: which one for which patient
Statins split into two rough classes by how easily they cross cell membranes. Lipophilic statins — atorvastatin, simvastatin, lovastatin, fluvastatin, pitavastatin — penetrate muscle and central nervous system tissue more readily and are metabolized largely by CYP3A4. Hydrophilic statins — rosuvastatin and pravastatin — are more liver-selective and are less dependent on CYP3A4.
The practical implications: patients on CYP3A4-inducing or -inhibiting medications (macrolides, azole antifungals, protease inhibitors, some anti-seizure drugs, grapefruit juice in large volumes) have fewer drug-interaction problems on rosuvastatin or pravastatin. Patients with a history of statin-associated muscle symptoms often tolerate a hydrophilic switch better than a repeat trial of the same lipophilic drug. And older adults with polypharmacy exposure tend to have cleaner interaction profiles on rosuvastatin.
The trade-off is that rosuvastatin is renally cleared and requires dose reduction at eGFR under 30 mL/min/1.73 m² — atorvastatin is hepatically cleared and does not.
Statin timing: does it matter when you take it?
The traditional rule — take short-half-life statins at bedtime because cholesterol synthesis peaks overnight — applies to simvastatin, lovastatin, pravastatin, and fluvastatin (half-lives 1 to 6 hours). Atorvastatin (half-life 14 hours), rosuvastatin (half-life 19 hours), and pitavastatin (half-life 12 hours) can be taken at any time of day with equivalent LDL effect.
The practical takeaway: adherence trumps timing. A patient who is more likely to remember an evening statin should take it in the evening; a patient who is more likely to remember a morning statin with breakfast should take it in the morning. Missed doses cost more LDL protection than sub-optimal timing.
Statin-drug interactions that actually matter
The interaction list is long but the meaningful ones are short. Amiodarone, diltiazem, and verapamil raise simvastatin and lovastatin exposure significantly — the FDA capped simvastatin at 20 mg daily when co-prescribed with amiodarone. Clarithromycin and itraconazole substantially raise lipophilic-statin exposure and increase myopathy risk; a temporary statin hold during a short antibiotic course is often the cleanest approach. Gemfibrozil roughly doubles statin exposure and is the highest-risk fibrate combination — fenofibrate is preferred when a fibrate is needed alongside a statin. Cyclosporine and tacrolimus in post-transplant patients require careful statin selection and dose reduction.
Grapefruit juice is real but often overstated — the effect matters most for simvastatin and lovastatin at high doses and habitual daily grapefruit intake. Occasional grapefruit is not a myopathy trigger.
Beyond statins: bempedoic acid, ezetimibe, and PCSK9 inhibitors in 2026
The non-statin LDL-lowering shelf has broadened significantly since 2020. Each class has a specific role in the decision tree, and all four modern options have positive cardiovascular-outcome trials backing their use.
Ezetimibe (Zetia, generic since 2016) blocks the NPC1L1 intestinal cholesterol transporter and adds roughly 15 to 20 percent LDL reduction on top of a statin. IMPROVE-IT 2015 (Cannon, NEJM 372:2387) randomized post-ACS patients to simvastatin plus ezetimibe versus simvastatin alone and showed a 6.4 percent relative reduction in the 7-year primary endpoint. It is cheap, oral, well tolerated, and is almost always the first add-on when statin monotherapy is not enough.
Bempedoic acid (Nexletol, Nexlizet with ezetimibe) is a non-statin that works one enzymatic step upstream of HMG-CoA reductase — it is activated in the liver but not in muscle, so muscle-symptom risk is markedly lower than with statins. CLEAR Outcomes 2023 (Nissen, NEJM 388:1353) randomized 13,970 statin-intolerant patients at high cardiovascular risk to bempedoic acid or placebo; over 3.4 years bempedoic acid reduced the 4-point MACE endpoint by 13 percent. Typical LDL drop is 17 to 25 percent as monotherapy and about 40 percent when combined with ezetimibe. Watchouts: mild uric-acid rise and a small increase in tendon-rupture signal in the trial.
PCSK9 inhibitors (evolocumab / Repatha, alirocumab / Praluent) are monoclonal antibodies given as a subcutaneous injection every 2 to 4 weeks. FOURIER 2017 (Sabatine, NEJM 376:1713) showed a 15 percent MACE reduction in stable ASCVD on evolocumab plus statin. ODYSSEY OUTCOMES 2018 (Schwartz, NEJM 379:2097) showed a similar 15 percent MACE reduction with alirocumab in post-ACS patients. LDL drops of 50 to 60 percent on top of a statin are typical — mean on-treatment LDL below 30 mg/dL is common. Cost has fallen substantially since launch: 2026 wholesale acquisition cost for evolocumab is roughly $4,750 per year (down from about $14,600 at launch), and Medicare Part B typically covers PCSK9 inhibitors after an acute coronary syndrome or in familial hypercholesterolemia.
Inclisiran (Leqvio) is a small-interfering RNA that silences hepatic PCSK9 production. It is given as two loading injections and then twice-yearly maintenance — the twice-a-year dosing is the differentiator against monoclonal-antibody PCSK9 inhibitors. ORION-11 2020 (Ray, NEJM 382:1507) showed a durable ~50 percent LDL reduction. The cardiovascular-outcomes trial (ORION-4) is ongoing.
Decision framework in practice:
- Weight loss + moderate-intensity statin as first line.
- If LDL remains above goal at 8 to 12 weeks, add ezetimibe (cheap, well tolerated, 15–20% additional drop).
- If LDL is still above goal, escalate the statin to high intensity if not already there.
- If the patient is statin-intolerant or the residual LDL is very high (FH, secondary prevention with LDL still ≥ 70 mg/dL on maximal statin plus ezetimibe), add bempedoic acid or a PCSK9 inhibitor.
- Inclisiran is a reasonable choice when adherence to injectable-antibody dosing is a problem.
Weight-loss-driven LDL reduction typically produces 5 to 15 mg/dL of movement — helpful, but rarely sufficient alone in high-risk patients. The combination of lifestyle plus the right pharmacotherapy is what actually delivers the secondary-prevention LDL target.
Safety monitoring on the non-statin add-ons
Each of the four modern non-statin options has a specific monitoring profile worth knowing before starting.
- Ezetimibe — no routine lab monitoring beyond the standard lipid recheck at 8 to 12 weeks. Rare hepatic transaminase rise; a single ALT/AST check at 3 months is reasonable but not required.
- Bempedoic acid — check uric acid at baseline and 4 weeks; the drug raises serum uric acid by roughly 0.8 mg/dL on average and can precipitate gout in adults with a prior history. There was a small excess of tendon-rupture events in CLEAR Outcomes; counsel patients to report Achilles or patellar tendon pain promptly.
- PCSK9 monoclonal antibodies — injection-site reactions in about 5 percent, mostly mild and self-limited. Rare hypersensitivity reactions. No routine lab monitoring beyond lipid rechecks.
- Inclisiran — injection-site reactions similar to PCSK9 monoclonals; no dedicated safety monitoring beyond lipid follow-up.
None of the four requires the periodic transaminase monitoring that early statin guidance suggested. The 2012 FDA update removed routine liver-function monitoring from statin labeling for the same reason — hepatotoxicity is rare and better detected clinically than by scheduled labs.
Comparing the non-statin options at a glance
| Drug | Class | LDL % drop (on statin) | Route | Frequency | CV outcomes trial |
|---|---|---|---|---|---|
| Ezetimibe | Cholesterol absorption inhibitor | −15 to −20% | Oral | Daily | IMPROVE-IT 2015 |
| Bempedoic acid | ATP-citrate lyase inhibitor | −17 to −25% | Oral | Daily | CLEAR Outcomes 2023 |
| Evolocumab / Alirocumab | PCSK9 monoclonal antibody | −50 to −60% | SC injection | Every 2 or 4 weeks | FOURIER 2017 / ODYSSEY 2018 |
| Inclisiran | PCSK9 siRNA | −50% | SC injection | Twice yearly | ORION-4 (ongoing) |
Lipoprotein(a): the risk factor most people never test
Lipoprotein(a) — Lp(a) — is an LDL-like particle with an added apolipoprotein(a) tail. Blood levels are about 80 to 90 percent genetically determined, essentially fixed for life after age 5, and largely unmoved by lifestyle changes including weight loss. Elevated Lp(a) is present in about 1 in 5 adults and roughly doubles cardiovascular risk at the highest quintile.
The 2022 European Atherosclerosis Society consensus (Kronenberg) recommends a one-time Lp(a) measurement in every adult as part of cardiovascular risk assessment. The 2018 ACC/AHA guideline treats Lp(a) ≥ 50 mg/dL (or ≥ 125 nmol/L) as a risk enhancer that can move a borderline patient into “statin indicated” territory.
Practical implications for the weight-loss reader:
- Elevated Lp(a) does not move with weight loss, diet, or statin therapy. Do not expect a repeat test to show improvement.
- Elevated Lp(a) is a reason to be more aggressive with the modifiable levers — LDL, blood pressure, weight, smoking — since baseline risk is higher.
- Two Lp(a)-specific drugs (pelacarsen, olpasiran) are in Phase 3 outcomes trials expected to read out in 2027 to 2028. If those trials show CV benefit, the treatment landscape will shift.
- Statins do not lower Lp(a); PCSK9 inhibitors lower it by 20 to 25 percent, which is a common secondary reason to start one in a very-high-risk patient.
If you have never had Lp(a) checked and you have a family history of premature ASCVD, ask for it at your next lipid draw. It is inexpensive, one-time, and changes the risk conversation.
Choosing between bempedoic acid and a PCSK9 inhibitor
Both classes are indicated in statin-intolerant or high-residual-risk patients. Bempedoic acid is oral, cheap (generic exposure is coming in 2026), and adds about 20 percent LDL reduction. PCSK9 inhibitors are injectable, more expensive, and add about 55 percent. The rough decision heuristic:
- Bempedoic acid — modest residual risk, LDL 20 to 40 mg/dL above target, patient prefers oral therapy, cost is a constraint, statin fully intolerant.
- PCSK9 inhibitor — high residual risk (established ASCVD with LDL still ≥ 70 mg/dL on maximal tolerated statin plus ezetimibe), FH, LDL > 50 mg/dL above target, willing and able to self-inject.
- Combine bempedoic acid and ezetimibe (Nexlizet) as a first oral escalation before jumping to an injectable.
Diet patterns for cholesterol: the ones with the strongest evidence
Not every “heart-healthy” diet has equivalent trial data behind it. The five patterns below are the ones with the strongest LDL evidence — ranked by the size of the LDL move in the landmark trial that established each.
| Diet pattern | Landmark trial | LDL change | HDL change | Triglycerides |
|---|---|---|---|---|
| Portfolio Diet (Jenkins 2011) | CMAJ 183:1911 | −13% | +2% | −8% |
| Mediterranean (PREDIMED, Estruch 2018) | NEJM 378:e34 | −5% | +5% | −13% |
| DASH (Sacks 2001) | NEJM 344:3 | −11% | −5% | Neutral |
| Low-carb / keto (Bhanpuri 2018) | Cardiovasc Diabetol 17:56 | −5 to +5% (variable) | +13% | −24% |
| Vegan (Barnard 2006) | Diabetes Care 29:1777 | −22% | −4% | Neutral |
The Portfolio Diet — assembled by David Jenkins at the University of Toronto — is the single strongest food-first LDL intervention published. It stacks four LDL-lowering components: soy protein (25 g/day), soluble fiber (10 g/day from psyllium, oats, barley), plant sterols (2 g/day from fortified spreads or supplements), and tree nuts (about 45 g/day, mostly almonds). In the 2011 controlled-feeding trial the pattern delivered a 13 percent LDL drop — on par with a low-dose statin. The 2023 CardioNutrition update (Chiavaroli) confirmed the finding in a longer-term dietary counseling setting.
The Mediterranean pattern — with PREDIMED as its anchor trial — delivers a smaller LDL move (5 percent) but is the only diet pattern with a hard cardiovascular-outcome trial behind it. The MACE reduction of about 30 percent is not fully explained by the LDL change; polyphenols in extra-virgin olive oil, nuts, and red wine appear to contribute through anti-inflammatory and endothelial pathways.
DASH — the original 2001 trial — produced an 11 percent LDL drop mostly through fruit and vegetable volume, whole grains, low-fat dairy, and reduced sodium. It is the pattern with the strongest blood pressure evidence, which pairs neatly with weight loss for cardio-metabolic risk. See DASH diet for weight loss for the food list and weekly plan.
Plant sterols (2 g/day from fortified spreads or supplements) deliver an 8 to 10 percent LDL drop on their own — this is the single food-based intervention with the biggest per-serving LDL move. Ras 2014 (British Journal of Nutrition 112:214) pooled 124 trials to confirm the dose-response.
Soluble fiber (10 g/day from psyllium, oats, legumes) delivers a 5 percent LDL drop by binding bile acids in the gut and driving hepatic LDL uptake (Brown 1999, Am J Clin Nutr 69:30). The cheapest food-based route is oats plus beans; psyllium (Metamucil, generic) delivers about 7 g of soluble fiber per rounded tablespoon and is the fastest-tracked option.
Low-carb and ketogenic patterns are triglyceride-friendly (24 percent drop in Bhanpuri 2018) and HDL-friendly (13 percent rise), but the LDL response is individual. About 30 to 50 percent of adherents see LDL rise on a high-saturated-fat keto pattern, and a subset of lean, metabolically-healthy responders — sometimes called lean mass hyper-responders — see LDL climb 50 to 200 percent. Monitor lipids at 12 weeks; if LDL rises more than 30 mg/dL, cut saturated fat below 7 percent of energy, swap to olive oil and nuts as the fat base, or switch pattern. See low-carb / keto diets for the rechecking protocol. The hyper-responder pattern is most exaggerated on the strictest plant-free extension of low-carb — the carnivore diet — which concentrates saturated fat at levels well above any keto template that includes plants; a baseline lipid panel with ApoB and a 30-day repeat are the minimum defensible monitoring floor if that pattern is being tried.
Vegan patterns deliver the largest mean LDL drop in the table (22 percent in Barnard 2006). The mechanism is straightforward — near-zero saturated fat, high soluble fiber, and no dietary cholesterol. Adherence and B12 supplementation are the practical constraints. See plant-based weight loss for the food list. For the Mediterranean pattern specifically, cross-link to Mediterranean diet and weight loss.
Per-food LDL levers, ranked
If diet patterns feel abstract, the per-food view is often more actionable. The rough LDL move per daily serving of each item below is drawn from the Ras 2014 sterol meta, the Brown 1999 fiber meta, the Jenkins Portfolio component analyses, and the Sabate almond and walnut trials.
| Food or component | Typical daily serving | LDL % drop |
|---|---|---|
| Plant sterols (fortified spread or supplement) | 2 g | 8–10% |
| Psyllium husk | 10 g (1 rounded tablespoon) | 5–7% |
| Tree nuts (almonds, walnuts) | 45 g | 3–5% |
| Soy protein | 25 g | 3–4% |
| Oats (rolled or steel-cut) | 3/4 cup dry, 3 g β-glucan | 5–7% |
| Beans, lentils, chickpeas | 1 cup cooked | 3–5% |
| Extra-virgin olive oil (replacing butter) | 2 tablespoons | 3–4% |
| Fatty fish (salmon, sardines) | 2 servings/wk | Neutral LDL; −10 to −20% triglycerides |
| Berries (mixed) | 1 cup | Modest polyphenol effect; adherence-relevant |
| Dark chocolate ≥ 70% cacao | 20–30 g | Neutral LDL; modest HDL rise |
The percentages are not additive by simple summation — some effects overlap (soluble fiber in oats and psyllium share a mechanism) and stacked effects show diminishing returns. But the pattern is real: three or four components together move LDL by 10 to 15 percent, and that is the mechanism behind the Portfolio Diet’s 13 percent aggregate move.
Portfolio Diet: exactly what to eat, day by day
The Portfolio Diet is often recommended in the abstract without the food-level detail. Here is the daily target from Jenkins 2011:
- 25 g of soy protein — one cup of soymilk (7 g) + 100 g of tofu or tempeh (17 g), or a soy-protein bar for either portion.
- 10 g of soluble fiber — 1 rounded tablespoon of psyllium husk (7 g) plus 1/2 cup of cooked oats (2 g) plus 1 apple (1 g).
- 2 g of plant sterols — either two 1-tablespoon servings of a sterol-fortified spread (Benecol, Take Control) or a 2 g plant-sterol supplement capsule.
- 45 g of tree nuts — a small handful of almonds is about 30 g; a mixed handful of almonds and walnuts hits the target.
Stacked as a complete pattern the mean LDL drop is 13 percent, but individual components deliver measurable moves too: the soluble fiber portion alone drops LDL 5 to 7 percent, the plant sterols another 8 to 10 percent, and the tree nuts 3 to 5 percent. The additivity is what makes the pattern work — no single component does the whole job.
Fiber sources ranked by soluble content
Not all “high-fiber” foods contribute equally to the LDL move. The mechanism is specifically soluble fiber — the fraction that dissolves in water, forms a gel in the gut, binds bile acids, and drives hepatic LDL uptake. Insoluble fiber (bran, wheat, most vegetable skins) has other benefits but does not touch LDL.
| Source | Serving | Soluble fiber (g) |
|---|---|---|
| Psyllium husk (Metamucil, generic) | 1 rounded tbsp | 6–7 |
| Oat bran | 1/2 cup dry | 3 |
| Rolled oats | 3/4 cup dry | 2 |
| Black beans | 1 cup cooked | 2.4 |
| Kidney beans | 1 cup cooked | 2.5 |
| Chickpeas | 1 cup cooked | 1.3 |
| Barley | 1 cup cooked | 1.8 |
| Apple with skin | 1 medium | 1.0 |
| Brussels sprouts | 1 cup cooked | 2 |
| Chia seeds | 2 tbsp | 2 |
The fastest single-food route to 10 g of soluble fiber a day is 1 tablespoon of psyllium plus 3/4 cup of oats plus a cup of cooked beans. That daily stack delivers roughly the LDL move seen in the Portfolio Diet’s fiber component. If you are anchoring the plan around one oat-based breakfast, the oatmeal for weight loss pillar walks through hitting the 3 g/day beta-glucan FDA threshold from one or two daily bowls.
Alcohol, coffee, and tea: the small levers that add up
Three beverages worth naming for lipid effect.
Alcohol raises HDL modestly at moderate intake (about 1 mg/dL of HDL per drink per day of habitual intake) but also raises triglycerides sharply, particularly with beer, sweet wine, and mixed drinks. In adults with triglycerides above 150 mg/dL, the alcohol contribution is often the biggest movable lever — a 4-week alcohol break frequently drops triglycerides 30 to 60 mg/dL. Moderate alcohol is not a cardiovascular therapy; the 2018 alcohol-and-CV meta-analyses have deflated the earlier “protective” claims.
Coffee raises LDL slightly when brewed by methods that do not filter out diterpenes (French press, Turkish, boiled Scandinavian). Filtered drip and pod coffee are essentially neutral. Two 8-ounce cups of unfiltered coffee daily can add 10 to 20 mg/dL of LDL over months (Ranheim 2005 review). If your LDL is at target on filtered coffee, switching to French press is a small but real cost.
Green and black tea produce a modest LDL drop (3 to 5 percent) in meta-analysis, driven by catechins in green tea and thearubigins in black tea. The effect is small and adherence-relevant more than magnitude-relevant.
Combining patterns: what actually happens in real diets
Most patients do not eat “the Portfolio Diet” or “the Mediterranean Diet” as a monolithic prescription. The real-world pattern is usually a mix — Mediterranean base with Portfolio components added (soy protein, plant sterols), or DASH backbone with olive oil substituted for the low-fat dairy fat. This is fine, and often better than any single pure pattern.
The one combination worth flagging is low-carb plus high saturated fat. If a keto pattern is the base, the LDL response depends heavily on what fills the fat calories. Butter, coconut oil, and fatty red meat drive LDL up in most people; olive oil, nuts, avocado, and fatty fish are LDL-neutral or LDL-lowering — the Peou 2016 Journal of Clinical Lipidology meta-analysis of 10 avocado-inclusive-diet trials specifically found ~2.5 mg/dL LDL reductions when avocado displaced saturated fat. A “Mediterranean keto” pattern with olive oil as the fat base is the pragmatic compromise for adults who want the triglyceride and blood-sugar benefits of low-carb without the LDL cost.
After weight loss: do I still need a statin? A decision matrix
Weight loss shifts the risk conversation but does not automatically end it. The matrix below is a simplification of the 2018 ACC/AHA primary-prevention framework for a common question — “I lost the weight; what now?” — and is intended for context, not medical advice. The final call belongs to you and your clinician after a real 10-year ASCVD risk calculation and a repeat lipid panel.
| After 5–10% weight loss and diet, if your LDL is… | And your ASCVD risk is… | Then… | Cross-link |
|---|---|---|---|
| < 100 mg/dL | Low (10-yr < 5%) | Lifestyle only; recheck lipids at 12 months | weight-loss maintenance |
| 100–130 mg/dL | Borderline (5–7.5%) | Discuss statin with clinician; consider ezetimibe first-line if statin-intolerant | — |
| 130–160 mg/dL | Intermediate (7.5–20%) | Moderate-intensity statin usually indicated; weight-loss maintenance is still primary | — |
| ≥ 160 mg/dL or FH pattern | Any | High-intensity statin ± add-on therapy; weight loss is adjunctive, not sufficient | — |
Two caveats deserve emphasis. First, the matrix assumes primary prevention — no history of coronary disease, ischemic stroke, or peripheral arterial disease. Anyone with established ASCVD is in secondary prevention, where LDL under 70 mg/dL (and often under 55 mg/dL) is the target and a high-intensity statin is the default regardless of the current number. Second, the matrix does not incorporate risk enhancers — chronic kidney disease, chronic inflammatory disease, family history of premature ASCVD, lipoprotein(a) elevation, or a positive coronary artery calcium (CAC) score. Any one of these can move a borderline patient into “statin indicated” territory even when the raw ASCVD risk score is under 7.5 percent.
This is a summary of ACC/AHA 2018 primary-prevention guidance for context. This is not medical advice. The final call belongs to the patient and their clinician after a full history, examination, and repeat lipid panel.
Risk enhancers and the coronary artery calcium (CAC) score
The 2018 ACC/AHA guideline named a set of “risk enhancers” that push a borderline-risk patient toward starting a statin even when the raw 10-year ASCVD risk is under 7.5 percent:
- Family history of premature ASCVD (male first-degree relative < 55, female < 65).
- Persistently elevated LDL (≥ 160 mg/dL) despite lifestyle change.
- Chronic kidney disease (eGFR 15 to 59 mL/min/1.73 m²).
- Metabolic syndrome (see metabolic syndrome and weight loss).
- Chronic inflammatory disease (rheumatoid arthritis, psoriasis, HIV).
- History of preeclampsia or premature menopause.
- Elevated lipoprotein(a) — often taken as > 50 mg/dL or > 125 nmol/L.
- Elevated apoB (> 130 mg/dL) or hsCRP (≥ 2 mg/L).
When multiple risk enhancers are present or the decision is still uncertain, a coronary artery calcium (CAC) score is often the tiebreaker. CAC = 0 in an adult under 75 with no diabetes and no smoking history is strong evidence for deferring statin therapy — the 10-year event rate is low. CAC ≥ 100, or CAC ≥ 75th percentile for age and sex, is strong evidence for starting statin therapy regardless of the calculated risk score. CAC 1 to 99 is a middle zone where shared decision-making dominates.
The MESA (Multi-Ethnic Study of Atherosclerosis) risk calculator incorporates the CAC score into the 10-year ASCVD estimate and is often the most precise available tool for this decision.
Special case: patients who have hit the “statin ceiling”
A subset of adults on maximally tolerated statin plus ezetimibe still cannot reach their LDL target — most often patients with heterozygous familial hypercholesterolemia, post-ACS patients with baseline LDL above 190, or patients with statin-associated muscle symptoms that limit the dose. Weight loss in this group still helps at the margins (5 to 15 mg/dL) but is rarely the deciding lever.
The decision tree in this pocket of the population is well-established: escalate to a PCSK9 inhibitor if the residual LDL is more than 30 mg/dL above target, or add bempedoic acid if the residual is closer to 20 mg/dL. Inclisiran becomes a reasonable choice when adherence to twice-monthly self-injection is a problem. All three options have insurance-coverage pathways for FH or established ASCVD; a lipid specialist referral is often the fastest route to authorization.
For patients in this group, the weight-loss work should be reframed. It is not “how much LDL can I move with lifestyle” — it is “how much of the multifactorial risk (blood pressure, weight, glucose, inflammation, adherence) can I move.” Weight loss remains a leverage point for the aggregate risk even when the LDL is already at goal on maximal pharmacotherapy.
Special case: post-menopausal women
The lipid trajectory across menopause complicates the decision matrix. The Study of Women’s Health Across the Nation (SWAN) cohort showed a 10 to 20 percent LDL rise across the transition, largely independent of weight change. A woman who successfully loses 8 percent of body weight during her early 50s may still see her LDL drift upward because the hormonal transition is doing more than the weight loss can counter.
The practical implication is that the “borderline” row in the matrix above frequently reclassifies upward in perimenopausal women — an LDL of 118 pre-transition can become 138 post-transition on the same eating pattern. The 6-month recheck rule still applies, but the trigger for the statin conversation often arrives sooner than for a similarly-aged man. See menopause and weight loss for the broader frame.
Special case: diabetes
Adults with Type 2 diabetes and age 40 to 75 are treated as a distinct risk group in the 2018 ACC/AHA guideline — a moderate-intensity statin is the default regardless of LDL, and high-intensity is preferred if the 10-year ASCVD risk is above 20 percent or if additional diabetes-specific risk enhancers (long diabetes duration, albuminuria, retinopathy, low eGFR) are present. The rationale is that diabetes accelerates atherosclerosis independently of LDL, and the statin benefit is well documented in this group across multiple large trials.
Weight loss in Type 2 diabetes still matters — it reduces medication burden, lowers HbA1c, and improves lipid panel in the same directions as in non-diabetic adults. But the statin conversation is more often “which one and at what dose” than “whether or not.” See diabetes and weight loss for the broader frame.
Special case: adults over 75
Statin decision-making in adults over 75 is genuinely uncertain. The 2018 guideline acknowledges that most of the primary-prevention statin evidence is drawn from adults under 75, and the risk-benefit calculation shifts as competing mortality risks rise. STAREE (a large primary-prevention trial in adults ≥ 70) is due to complete in 2027 and will clarify the picture.
For now: adults over 75 with a history of ASCVD stay on their statin. Adults over 75 without ASCVD and with LDL under 190 mg/dL are in a shared-decision-making zone where CAC scoring, functional status, life expectancy, and polypharmacy exposure all matter more than the raw ASCVD score.
When the answer is “not yet — recheck in 6 months”
For borderline patients who have hit their 5 to 10 percent weight-loss target and moved into a lower-risk category, a 6-month lipid recheck plus updated ASCVD risk calculation is the honest deferral. This is not the same as “the answer is no statin.” It is “we do not need to decide today.” Two conditions matter for that deferral to be safe:
- The weight loss is maintained at the 6-month mark. Rebound weight regain returns the lipid profile to baseline within a year.
- The patient has a plan for long-term maintenance — a durable eating pattern, ongoing physical activity, and where relevant continued GLP-1 therapy. Without that plan, the deferral becomes a delay before a statin conversation that could have started earlier.
For the maintenance frame see weight-loss maintenance.
Cholesterol and Weight Loss FAQ
How much weight do I need to lose to lower my cholesterol? About 5 to 10 percent body weight is the threshold for a meaningful lipid shift — roughly 5 to 10 mg/dL off LDL, 20 to 40 mg/dL off triglycerides, and 2 to 4 mg/dL added to HDL (Datillo and Kris-Etherton 1992). For a 200 lb adult, that is a 10 to 20 lb loss.
Can weight loss replace a statin? Sometimes, for borderline LDL and low overall cardiovascular risk. For most adults with established disease, diabetes, or FH, lifestyle reduces the required dose but does not replace the drug. Statins drop LDL 30 to 55 percent — a magnitude lifestyle alone reaches only at the extremes.
Does Ozempic or Wegovy lower cholesterol? Yes, modestly — about -10% LDL and -22% triglycerides at 68 weeks in STEP-1. Tirzepatide is slightly stronger in SURMOUNT-1 at about -13% LDL and -25% triglycerides. The effect tracks weight loss; they are useful adjuncts, not stand-alone cholesterol drugs.
Will losing weight raise my HDL? Yes, but slowly — about 1 mg/dL per 3 kg lost during active loss, with the bigger and more durable HDL rise showing up after weight stabilizes. Aerobic exercise is the more powerful HDL lever.
Does keto raise LDL? It can, with wide person-to-person variation. Mean LDL is roughly unchanged, but a subset of lean responders sees LDL rise sharply. Re-check at 8 to 12 weeks; if LDL has climbed, swap saturated for monounsaturated fat and re-test.
How fast do cholesterol levels drop after starting weight loss? Triglycerides within 2 to 4 weeks, LDL by 6 to 12 weeks, HDL slowest. Cutting sugar-sweetened drinks and refined carbs gives the fastest visible change.
Is dietary cholesterol from eggs or shrimp bad for my LDL? For most adults, no — the 2015 guidelines removed the cholesterol cap because the evidence is weak. About 25% of adults are hyper-responders and should still cap intake if their baseline LDL is elevated. The eggs for weight loss guide covers the per-day dose ranges the pooled cohort evidence supports for the general population and the FH/CVD/T2D exception groups.
What is non-HDL cholesterol? Total cholesterol minus HDL — captures every atherogenic particle in one number. The 2018 ACC/AHA guideline made it a co-primary target. Optimal is under 130 mg/dL.
How long until my LDL drops after I start losing weight? Expect the first measurable LDL change at week 6 to 8, with the bulk of the effect landing between months 3 and 6. Triglycerides move faster (2 to 4 weeks) and HDL moves last. If nothing has moved by week 8 despite a real 3 to 5 percent loss, the food pattern is usually the reason — swap saturated fat for mono- and polyunsaturated and add 10 g/day of soluble fiber. Re-test at 8 to 12 weeks, not week 4.
Do I need to fast for my next lipid panel after weight loss? For most adults, no. The 2016 EAS/EFLM consensus and the 2018 ACC/AHA cholesterol guideline both accept non-fasting panels for routine screening and follow-up — LDL, HDL, and non-HDL are essentially unchanged by a recent meal; triglycerides run 20 to 30 mg/dL higher non-fasting. Fasting is still preferred if triglycerides are above 400 mg/dL, if you are being worked up for familial dyslipidemia, or if you are on a fibrate. Ask your clinician before switching modes on a statin.
Can bariatric surgery lower cholesterol enough to stop my statin? Sometimes — STAMPEDE and SOS show 25 to 40 mg/dL LDL drops and durable triglyceride and HDL improvements after Roux-en-Y or sleeve, and a real share of patients discontinue lipid-lowering therapy 1 to 3 years post-op. Do not stop on your own; the call belongs to your prescriber and depends on baseline cardiovascular risk and whether LDL stays at target. See cardiovascular disease and weight loss for the risk-stratified frame.
Does apoB drop with weight loss the same way LDL does? Yes, and often more cleanly. ApoB counts atherogenic particles directly, so it captures LDL, VLDL, IDL, and lipoprotein(a) burden in one number — especially useful when triglycerides are high and standard LDL is unreliable. A 5 to 10 percent loss typically drops ApoB by 5 to 15 mg/dL, similar in magnitude to the LDL move. When LDL and ApoB disagree (LDL low but ApoB high), ApoB usually wins the risk conversation — see metabolic syndrome and weight loss for why in the triglyceride-rich pattern.
Sources
- Datillo AM, Kris-Etherton PM. Effects of weight reduction on blood lipids and lipoproteins: a meta-analysis. American Journal of Clinical Nutrition (1992).
- Mensink RP, Zock PL, Kester ADM, Katan MB. Effects of dietary fatty acids and carbohydrates on the ratio of serum total to HDL cholesterol and on serum lipids and apolipoproteins: a meta-analysis of 60 controlled trials. American Journal of Clinical Nutrition (2003).
- Hooper L, Martin N, Jimoh OF, Kirk C, Foster E, Abdelhamid AS. Reduction in saturated fat intake for cardiovascular disease. Cochrane Database of Systematic Reviews (2020).
- Brown L, Rosner B, Willett WW, Sacks FM. Cholesterol-lowering effects of dietary fiber: a meta-analysis. American Journal of Clinical Nutrition (1999).
- Estruch R, Ros E, Salas-Salvadó J, Covas MI, Corella D, Arós F, et al. Primary Prevention of Cardiovascular Disease with a Mediterranean Diet Supplemented with Extra-Virgin Olive Oil or Nuts (PREDIMED). New England Journal of Medicine (2018).
- Kraus WE, Houmard JA, Duscha BD, Knetzger KJ, Wharton MB, McCartney JS, et al. Effects of the Amount and Intensity of Exercise on Plasma Lipoproteins (STRRIDE). New England Journal of Medicine (2002).
- Wilding JPH, Batterham RL, Calanna S, Davies M, Van Gaal LF, Lingvay I, et al. Once-Weekly Semaglutide in Adults with Overweight or Obesity (STEP-1). New England Journal of Medicine (2021).
- Jastreboff AM, Aronne LJ, Ahmad NN, Wharton S, Connery L, Alves B, et al. Tirzepatide Once Weekly for the Treatment of Obesity (SURMOUNT-1). New England Journal of Medicine (2022).
- Nordestgaard BG, Chapman MJ, Humphries SE, Ginsberg HN, Masana L, Descamps OS, et al. Familial hypercholesterolaemia is underdiagnosed and undertreated in the general population: guidance for clinicians to prevent coronary heart disease. European Heart Journal (2013).
- Grundy SM, Stone NJ, Bailey AL, Beam C, Birtcher KK, Blumenthal RS, et al. 2018 AHA/ACC/AACVPR/AAPA/ABC/ACPM/ADA/AGS/APhA/ASPC/NLA/PCNA Guideline on the Management of Blood Cholesterol. Circulation (2018).
- Lincoff AM, Brown-Frandsen K, Colhoun HM, Deanfield J, Emerson SS, Esbjerg S, et al. Semaglutide and Cardiovascular Outcomes in Obesity without Diabetes (SELECT). New England Journal of Medicine (2023).
- Aronne LJ, Sattar N, Horn DB, Bays HE, Wharton S, Lin WY, et al. Continued Treatment With Tirzepatide for Maintenance of Weight Reduction in Adults With Obesity (SURMOUNT-4). JAMA (2024).
- Cholesterol Treatment Trialists' (CTT) Collaboration. Efficacy and safety of more intensive lowering of LDL cholesterol: a meta-analysis of data from 170 000 participants in 26 randomised trials. Lancet (2010).
- Herrett E, Williamson E, Brack K, Beaumont D, Perkins A, Thayne A, et al. Statin treatment and muscle symptoms: series of randomised, placebo controlled n-of-1 trials. BMJ (2021).
- Nissen SE, Lincoff AM, Brennan D, Ray KK, Mason D, Kastelein JJP, et al. Bempedoic Acid and Cardiovascular Outcomes in Statin-Intolerant Patients (CLEAR Outcomes). New England Journal of Medicine (2023).
- Sabatine MS, Giugliano RP, Keech AC, Honarpour N, Wiviott SD, Murphy SA, et al. Evolocumab and Clinical Outcomes in Patients with Cardiovascular Disease (FOURIER). New England Journal of Medicine (2017).
- Schwartz GG, Steg PG, Szarek M, Bhatt DL, Bittner VA, Diaz R, et al. Alirocumab and Cardiovascular Outcomes after Acute Coronary Syndrome (ODYSSEY OUTCOMES). New England Journal of Medicine (2018).
- Ray KK, Wright RS, Kallend D, Koenig W, Leiter LA, Raal FJ, et al. Two Phase 3 Trials of Inclisiran in Patients with Elevated LDL Cholesterol (ORION-10 and ORION-11). New England Journal of Medicine (2020).
- Jenkins DJA, Jones PJH, Lamarche B, Kendall CWC, Faulkner D, Cermakova L, et al. Effect of a dietary portfolio of cholesterol-lowering foods given at 2 levels of intensity of dietary advice on serum lipids in hyperlipidemia. CMAJ (2011).
- Sacks FM, Svetkey LP, Vollmer WM, Appel LJ, Bray GA, Harsha D, et al. Effects on Blood Pressure of Reduced Dietary Sodium and the DASH Diet (DASH-Sodium). New England Journal of Medicine (2001).
- Bhanpuri NH, Hallberg SJ, Williams PT, McKenzie AL, Ballard KD, Campbell WW, et al. Cardiovascular disease risk factor responses to a type 2 diabetes care model including nutritional ketosis induced by sustained carbohydrate restriction at 1 year: an open label, non-randomized, controlled study. Cardiovascular Diabetology (2018).
- Barnard ND, Cohen J, Jenkins DJA, Turner-McGrievy G, Gloede L, Jaster B, et al. A Low-Fat Vegan Diet Improves Glycemic Control and Cardiovascular Risk Factors in Individuals With Type 2 Diabetes. Diabetes Care (2006).
- Ras RT, Geleijnse JM, Trautwein EA. LDL-cholesterol-lowering effect of plant sterols and stanols across different dose ranges: a meta-analysis of randomised controlled studies. British Journal of Nutrition (2014).